
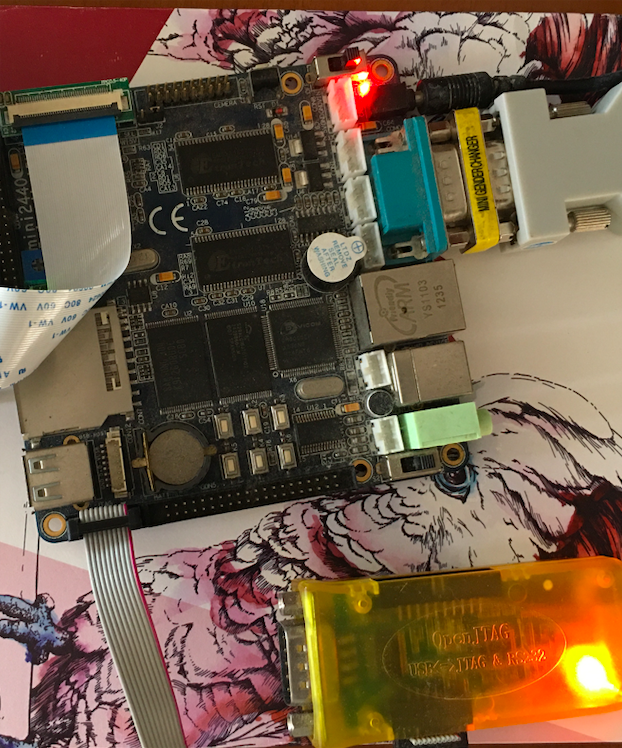
Debugging Mini2440 with OpenOCD
Bring board up for the first time, it usually involves debugging with JTAG, in this post I will be using OpenJTAG for mini2440, showing how to load program with it, first things need to do are:
- Connect OpenJTAG to MINI2440
- Power up MINI2440
- Plug OpenJTAG in Computer with Ubuntu (I am using 18.04) installed
Install OpenOCD
You can install OpenOCD directly with:
$ sudo apt install -y openocd
$ openocd --version
Open On-Chip Debugger 0.10.0
or build the latest version, the repository of OpenOCD is hosted on SF.net, it also hosts an official mirror at repo.or.cz.
$ sudo apt install libftdi-dev
$ git clone https://git.code.sf.net/p/openocd/code openocd
$ ./configure --enable-ft2232_libftdi
$ sudo make install
Configuration
In order to debug with OpenOCD, configuration file is required, there are examples
under directory /usr/share/openocd/scripts/board/ for reference, version 0.10.0
has config script for mini24440 committed by B Findlay, but for the
version 0.5.0 (which is the latest version when this document was written), it does
not exist, so I will keep it as close as the works I previously did, and write a
new script from scratch.
OpenJTAG was derived from OpenMoko debug board, we can see it’s hardware
information from output of lsusb:
lsusb  -vd 1457:5118

Bus 001 Device 012: ID 1457:5118 First International Computer, Inc. OpenMoko Neo1973 Debug board (V2+)
Device Descriptor:
  bLength                18
  bDescriptorType         1
  bcdUSB               2.00
  bDeviceClass            0 (Defined at Interface level)
  bDeviceSubClass         0
  bDeviceProtocol         0
  bMaxPacketSize0         8
  idVendor           0x1457 First International Computer, Inc.
  idProduct          0x5118 OpenMoko Neo1973 Debug board (V2+)
  bcdDevice            5.00
  iManufacturer           1 www.100ask.net
  iProduct                2 USB<=>JTAG&RS232
[...]
In order to make it working with OpenOCD, it must be configured with the following:
interface ftdi
ftdi_device_desc "USB<=>JTAG&RS232"
ftdi_vid_pid 0x1457 0x5118

ftdi_layout_init 0x0c08 0x0f1b
ftdi_layout_signal nTRST -data 0x0100 -noe 0x0400
ftdi_layout_signal nSRST -data 0x0200 -noe 0x0800

adapter_khz 6000

source [find target/samsung_s3c2440.cfg]
Detailed explanation can be found in Chapter 8: Debug Adapter Configuration of OpenOCD User’s Guide.
The configuration for S3C2440 is /usr/share/openocd/scripts/target/samsung_s3c2440.cfg,
this should also be included.
OpenOCD using libusb to control usb devices, udev rules may also needs to be added to the system:
cat << EOF | sudo tee -a /etc/udev/rules.d/89-openocd.rules
# OpenJTAG
SUBSYSTEM=="usb", ATTR{idVendor}=="1457", ATTR{idProduct}=="5118", MODE="0664", GROUP="plugdev"
EOF
sudo udevadm control -R
sudo udevadm trigger
At this point, openocd should be working, issue openocd or specify a config file
other than default openocd.cfg with -f:
$ leds openocd
Open On-Chip Debugger 0.10.0
Licensed under GNU GPL v2
For bug reports, read
	http://openocd.org/doc/doxygen/bugs.html
Info : auto-selecting first available session transport "jtag". To override use 'transport select <transport>'.
trst_and_srst separate srst_gates_jtag trst_push_pull srst_open_drain connect_deassert_srst
adapter speed: 6000 kHz
fast memory access is enabled
board_init
Info : clock speed 6000 kHz
Info : JTAG tap: s3c2440.cpu tap/device found: 0x0032409d (mfg: 0x04e (Samsung), part: 0x0324, ver: 0x0)
Info : Embedded ICE version 2
Info : s3c2440.cpu: hardware has 2 breakpoint/watchpoint units
OpenOCD Basics
Open another terminal and connect to OpenOCD with telnet:
$ telnet localhost 4444
Trying 127.0.0.1...
Connected to localhost.
Escape character is '^]'.
Open On-Chip Debugger
>
In OpenOCD window, below message will be shown:
Info : accepting 'telnet' connection on tcp/4444
And every command issued in the telnet session, the output will also show up in the OpenOCD window.
All commands supported by OpenOCD can be queried by help command, here are the
random commands I tried to get familiar with it:
> halt
target halted in ARM state due to debug-request, current mode: System
cpsr: 0x6000005f pc: 0x33f092ec
MMU: enabled, D-Cache: enabled, I-Cache: enabled
> arm920t cp15 2 0
2: 00000000
> step
target halted in ARM state due to single-step, current mode: System
cpsr: 0x6000005f pc: 0x33f092f0
MMU: disabled, D-Cache: disabled, I-Cache: disabled
> bp 0x30008120 4 hw
breakpoint set at 0x30008120
> poll
background polling: on
TAP: s3c2440.cpu (enabled)
target halted in ARM state due to single-step, current mode: System
cpsr: 0x6000005f pc: 0x33f092f0
MMU: disabled, D-Cache: disabled, I-Cache: disabled
> reset
JTAG tap: s3c2440.cpu tap/device found: 0x0032409d (mfg: 0x04e (Samsung), part: 0x0324, ver: 0x0)
NOTE! DCC downloads have not been enabled, defaulting to slow memory writes. Type 'help dcc'.
NOTE! Severe performance degradation without fast memory access enabled. Type 'help fast'.
To get rid of above warnings in reset command, add below to openocd.cfg
arm7_9 fast_memory_access enable
arm7_9 dcc_downloads enable
Debugging LED
Before download program to board, the cpu must be halted, MMU, D-Cache disabled,
current status of MMU and D-Cache can be checked with poll command, if enabled,
issue below commands to disable them:
arm920t cp 15 2 0
step
U-Boot also has command to turn cache off:
SMDK2440 # dcache
Data (writethrough) Cache is OFF
SMDK2440 # icache
Instruction Cache is OFF
To build led program, use the correct toolchain:
sudo apt install -y gcc-arm-linux-gnueabi
Load led program in telnet session
After system halt, Caches disabled, program can be loaded to RAM with load_image,
and resume from the load address, see the whole session below:
> halt
target halted in ARM state due to debug-request, current mode: Supervisor
cpsr: 0x20000053 pc: 0x33f9f638
MMU: disabled, D-Cache: enabled, I-Cache: enabled
> arm920t cp15 2 0
2: 00000000
> step
target halted in ARM state due to single-step, current mode: Supervisor
cpsr: 0x20000053 pc: 0x33f9f63c
MMU: disabled, D-Cache: disabled, I-Cache: disabled
> load_image leds
timed out while waiting for target debug-running
176 bytes written at address 0x00000000
downloaded 176 bytes in 0.520224s (0.330 KiB/s)
> resume 0
The LEDs on board will be flashing, counting from 0 to 15, to make life easier,
the command above can be put into a function as follows in openocd.cfg:
proc load_leds { } {
	halt
	arm920t cp15 2 0
	step
	load_image leds
	resume 0
}
Issue load_leds will light the LEDs, just like normal command.
By default, OpenOCD only listen on loopback interface, if you want remote access,
and made sure there is no security issue, then use bindto to enable it, this is
documented in the 15.1 Server Commands section of OpenOCD online doc:
bindto 0.0.0.0
bindto 192.168.0.3
Debug with gdb
I cannot find any prebuild gdb for arm-linux, so I downloaded v9.2 from GNU’s FTP server and build it from source code:
mkdir gdb-9.2/build
cd gdb-9.2/build
../configure --target=arm-linux-gnueabi
make
sudo make install
Before debugging with gdb, the cpu must be halted, add hardware breakpoint before
resume in openocd.cfg:
bp 0x4 4 hw
Then load led program in telnet window:
telnet localhost 4444
Trying 127.0.0.1...
Connected to localhost.
Escape character is '^]'.
Open On-Chip Debugger
> load_leds
2: 00000000
target halted in ARM state due to single-step, current mode: Supervisor
cpsr: 0x60000053 pc: 0x000007dc
MMU: disabled, D-Cache: disabled, I-Cache: disabled
timed out while waiting for target debug-running
176 bytes written at address 0x00000000
downloaded 176 bytes in 0.519162s (0.331 KiB/s)
breakpoint set at 0x00000004
target halted in ARM state due to breakpoint, current mode: Supervisor
cpsr: 0x60000053 pc: 0x00000004
MMU: disabled, D-Cache: disabled, I-Cache: disabled
Now we can debug with gdb:
➜  leds arm-linux-gnueabi-gdb leds
GNU gdb (GDB) 9.2
Copyright (C) 2020 Free Software Foundation, Inc.
License GPLv3+: GNU GPL version 3 or later <http://gnu.org/licenses/gpl.html>
This is free software: you are free to change and redistribute it.
There is NO WARRANTY, to the extent permitted by law.
Type "show copying" and "show warranty" for details.
This GDB was configured as "--host=x86_64-pc-linux-gnu --target=arm-linux-gnueabi".
Type "show configuration" for configuration details.
For bug reporting instructions, please see:
<http://www.gnu.org/software/gdb/bugs/>.
Find the GDB manual and other documentation resources online at:
    <http://www.gnu.org/software/gdb/documentation/>.

For help, type "help".
Type "apropos word" to search for commands related to "word"...
Reading symbols from leds...
(gdb) target remote localhost:3333
Remote debugging using localhost:3333
_start () at crt0.S:10
10	            mov     r1, #0x0
(gdb) b leds.c:24
Breakpoint 1 at 0x80: file leds.c, line 24.
(gdb) c
Continuing.

Breakpoint 1, main () at leds.c:24
24			if (++i == 16)
(gdb) c
Continuing.
The telnet part can be omitted, just issue those commands in gdb, and add monitor
before command, like this:
(gdb) monitor bp
Breakpoint(IVA): 0x00000004, 0x4, 1
(gdb) monitor rbp 4
(gdb) monitor load_leds
Similar to OpenOCD, the above commands can also be put into a script file, say
gdb.led:
target remote localhost:3333
monitor halt
monitor arm920t cp15 2 0
monitor step
monitor load_image leds
monitor bp 0x4 4 hw
monitor resume 0
The full openocd.cfg for leds program is below:
interface ftdi
ftdi_device_desc "USB<=>JTAG&RS232"
ftdi_vid_pid 0x1457 0x5118

ftdi_layout_init 0x0c08 0x0f1b
ftdi_layout_signal nTRST -data 0x0100 -noe 0x0400
ftdi_layout_signal nSRST -data 0x0200 -noe 0x0800

adapter_khz 6000

source [find target/samsung_s3c2440.cfg]

arm7_9 fast_memory_access enable
arm7_9 dcc_downloads enable

proc load_leds { } {
	halt
	arm920t cp15 2 0
	step
	load_image leds
	bp 0x4 4 hw
	resume 0
}
Debugging U-Boot
SRAM on most of the chip is limited, there is only 4KB on S3C2440, so there are two options to make U-Boot running on MINI2440, first one is relocate U-Boot code in first 4k, the second one is using SPL (Second Program Loader), in this section I will be using to latter one as example to illustrate how to debug U-Boot SPL and full blown U-Boot.
The code I am using is hosted on gitlab, to be more specific, the commit is af4e64a, more recent version should also work.
Load SPL to SRAM
Start OpenOCD which listening on port 3333 for gdb:
$ openocd -f board/samsung/mini2440/openocd.cfg
Open On-Chip Debugger 0.10.0+dev-ga8edbd0-dirty (2020-12-15-23:01)
Licensed under GNU GPL v2
For bug reports, read
	http://openocd.org/doc/doxygen/bugs.html
load_uboot
Info : Listening on port 6666 for tcl connections
Info : Listening on port 4444 for telnet connections
Info : clock speed 6000 kHz
Info : JTAG tap: s3c2440.cpu tap/device found: 0x0032409d (mfg: 0x04e (Samsung), part: 0x0324, ver: 0x0)
Info : Embedded ICE version 2
Info : s3c2440.cpu: hardware has 2 breakpoint/watchpoint units
Info : starting gdb server for s3c2440.cpu on 3333
Info : Listening on port 3333 for gdb connections
Connect to gdb server and load SPL code to SRAM:
$ arm-linux-gnueabi-gdb spl/u-boot-spl
GNU gdb (GDB) 9.2
Copyright (C) 2020 Free Software Foundation, Inc.
License GPLv3+: GNU GPL version 3 or later <http://gnu.org/licenses/gpl.html>
This is free software: you are free to change and redistribute it.
There is NO WARRANTY, to the extent permitted by law.
Type "show copying" and "show warranty" for details.
This GDB was configured as "--host=x86_64-pc-linux-gnu --target=arm-linux-gnueabi".
Type "show configuration" for configuration details.
For bug reporting instructions, please see:
<http://www.gnu.org/software/gdb/bugs/>.
Find the GDB manual and other documentation resources online at:
    <http://www.gnu.org/software/gdb/documentation/>.

For help, type "help".
Type "apropos word" to search for commands related to "word"...
Reading symbols from spl/u-boot-spl...
>>> target extended-remote localhost:3333
Remote debugging using localhost:3333

>>> dashboard registers -style list 'r0 r1 r2 r3 r4 r5 r6 r7 r8 r9 r10 r11 r12 sp lr pc cpsr'

>>> monitor reset
JTAG tap: s3c2440.cpu tap/device found: 0x0032409d (mfg: 0x04e (Samsung), part: 0x0324, ver: 0x0)
NOTE! DCC downloads have not been enabled, defaulting to slow memory writes. Type 'help dcc'.

>>> monitor halt
target halted in ARM state due to debug-request, current mode: Supervisor
cpsr: 0x200000d3 pc: 0x00000000
MMU: disabled, D-Cache: disabled, I-Cache: disabled

>>> load
Loading section .text, size 0xe60 lma 0x0
Loading section .rodata, size 0xf6 lma 0xe60
Loading section .data, size 0x80 lma 0xf58
Loading section .u_boot_list, size 0xc lma 0xfd8
Start address 0x00000000, load size 4066
Transfer rate: 64 KB/sec, 1016 bytes/write.
Confirm the interested part and set breakpoints, multiple of breakpoints can be set in one shot by placing the breakpoints to file like this:
b lowlevel_init.S:165

# branch to _main
b start.S:123

# branch to board_init_f
b crt0.S:117

# branch to board_init_r
b crt0.S:177

b spl_ram_load_image

# relocate
b crt0.S:127
NOTE:
The comments are supported but must in a separate line.
Now set the breakpoints and continue running:
>>> so[urce] breakpoint
No line 165 in file "lowlevel_init.S".
Make breakpoint pending on future shared library load? (y or [n]) [answered N; input not from terminal]
Breakpoint 1 at 0xa4: file arch/arm/cpu/arm920t/start.S, line 125.
Breakpoint 2 at 0x280: file arch/arm/lib/crt0.S, line 117.
Breakpoint 3 at 0x2b0: file arch/arm/lib/crt0.S, line 177.
Breakpoint 4 at 0x6d4: file common/spl/spl_ram.c, line 35.
Breakpoint 5 at 0x284: file arch/arm/lib/crt0.S, line 154.

>>> s
>>> c
After SDRAM initialization completed, the U-Boot code can be loaded to SDRAM and run from there, the download address for legacy u-boot.img is CONFIG_SYS_TEXT_BASE - sizeof(struct image_header) = 0x3380_0000 - 0x40, which is 0x337f_ffc0:
>>> monitor load_image u-boot.img 0x337fffc0
167868 bytes written at address 0x337fffc0
downloaded 167868 bytes in 2.343710s (69.946 KiB/s)
If debug for full version of U-Boot is required, setting breakpoint to it need to load its symbol:
>>> add-symbol-file u-boot
add symbol table from file "u-boot"
(y or n) y
Reading symbols from u-boot...
U-Boot will run at CONFIG_SYS_TEXT_BASE, and do relocate, to see the relocation
address, add #define DEBUG to include/initcall.h at the top of including file.
For my case, the relocation address is 0x33fc_6000:
Relocating to 33fc6000, new gd at 33bc5ee0, sp at 33bc5ec0
Add u-boot symbol at 0x33fc_6000 for U-Boot debugging after relocation:
>>> add-symbol-file u-boot 0x33fc6000
add symbol table from file "u-boot" at
	.text_addr = 0x33fc6000
(y or n) y
Reading symbols from u-boot...
The openocd.cfg used in this section:
#
# Openmoko USB JTAG/RS232 adapter
#
# http://wiki.openmoko.org/wiki/Debug_Board_v2
#

adapter driver ftdi
ftdi_device_desc "USB<=>JTAG&RS232"
ftdi_vid_pid 0x1457 0x5118

ftdi_layout_init 0x0c08 0x0f1b
ftdi_layout_signal nTRST -data 0x0100 -noe 0x0400
ftdi_layout_signal nSRST -data 0x0200 -noe 0x0800

adapter speed 6000
transport select jtag

source [find target/samsung_s3c2440.cfg]

arm7_9 fast_memory_access enable

bindto 0.0.0.0

set _NANDNAME $_CHIPNAME.nand
nand device _NANDNAME s3c2440 $_TARGETNAME

proc board_init { } {
	reset
	halt
	reg cpsr 0x1d3
}

proc load_uboot { } {
	load_image u-boot.img 0x337fffc0
}
Kernel Debugging
In order to debug kernel, kernel should be built with debug info, gdb scripts is optional:
+CONFIG_DEBUG_KERNEL=y
+CONFIG_DEBUG_INFO=y
+CONFIG_GDB_SCRIPTS=y
Breakpoint
Kernel uses virtual address, set breakpoint on virtual address only works after
MMU is enabled, we first set a hardware breakpoint on __turn_mmu_on and then set
software breakpoint after its completion, the virtual address of __turn_mmu_on
can be found in System.map:
$ rg __turn_mmu_on System.map -w
11:c0008200 T __turn_mmu_on
Setting hardware breakpoint need to know its physical address, it’s easy to figure
it out by comparing the virtual address of _text and kernel entry_point:
rg _text System.map -w
3:c0008000 T _text
So we set breakpoint on 0x30008200 to stop at __turn_mmu_on:
bp 0x30008200 4 hw
Take troubleshooting the kernel panic issue for example to show how to do kernel debug with JTAG and gdb.
Debugging kernel panic
I build the latest kernel with ramdisk, but kernel panics with following messages:
[    2.105979] Kernel panic - not syncing: Attempted to kill init! exitcode=0x00000004
[    2.108352] CPU: 0 PID: 1 Comm: linuxrc Not tainted 5.9.11-gaf063e31d492-dirty #47
[    2.115734] Hardware name: MINI2440
[    2.119301] [<c000dce8>] (unwind_backtrace) from [<c000c92c>] (show_stack+0x10/0x18)
[    2.126851] [<c000c92c>] (show_stack) from [<c0232440>] (dump_stack+0x20/0x2c)
[    2.133917] [<c0232440>] (dump_stack) from [<c0230fcc>] (panic+0xe0/0x2e0)
[    2.140688] [<c0230fcc>] (panic) from [<c00191f8>] (do_exit+0x788/0x9ac)
[    2.147217] [<c00191f8>] (do_exit) from [<c0019484>] (do_group_exit+0x3c/0xb4)
[    2.089596] [<c0019484>] (do_group_exit) from [<c0023d00>] (get_signal+0x114/0x798)
[    2.097112] [<c0023d00>] (get_signal) from [<c000c088>] (do_work_pending+0x1b4/0x554)
[    2.104758] [<c000c088>] (do_work_pending) from [<c00082c8>] (slow_work_pending+0xc/0x20)
[    2.112719] Exception stack(0xc3831fb0 to 0xc3831ff8)
[    2.117700] 1fa0:                                     be9cefd6 0022d2e0 00010000 00010034
[    2.125740] 1fc0: 0011fe94 00000000 00000000 00000000 00000000 00000000 00000000 00000000
[    2.133755] 1fe0: ffffffff be9cedd8 00000000 0011f7f4 20000010 ffffffff
[    2.140218] ---[ end Kernel panic - not syncing: Attempted to kill init! exitcode=0x00000004 ]---
- As always start OpenOCD first:
$ openocd -f board/samsung/mini2440/openocd.cfg - Start gdb to load U-Boot and kernel image
$ arm-linux-gnueabi-gdb spl/u-boot-spl -q >>> target extended-remote localhost:3333 Remote debugging using localhost:3333 >>> monitor reset JTAG tap: s3c2440.cpu tap/device found: 0x0032409d (mfg: 0x04e (Samsung), part: 0x0324, ver: 0x0) NOTE! DCC downloads have not been enabled, defaulting to slow memory writes. Type 'help dcc'. >>> monitor halt target halted in ARM state due to debug-request, current mode: Supervisor cpsr: 0x600000d3 pc: 0x00000000 MMU: disabled, D-Cache: disabled, I-Cache: disabled >>> load Loading section .text, size 0xe60 lma 0x0 Loading section .rodata, size 0xf6 lma 0xe60 Loading section .data, size 0x80 lma 0xf58 Loading section .u_boot_list, size 0xc lma 0xfd8 Start address 0x00000000, load size 4066 Transfer rate: 64 KB/sec, 1016 bytes/write. >>> tb _main Temporary breakpoint 1 at 0x260: file arch/arm/lib/crt0.S, line 102. >>> c >>> monitor load_image u-boot.img 0x337fffc0 169000 bytes written at address 0x337fffc0 downloaded 169000 bytes in 2.348685s (70.269 KiB/s) >>> monitor load_image /tftpboot/uImage 0x30800000 1408120 bytes written at address 0x30800000 downloaded 1408120 bytes in 19.656136s (69.959 KiB/s) - Set breakpoint and load kernel symbol with:
>>> monitor bp 0x30008200 4 hw >>> set confirm off >>> add-symbol-file ~/linux-5.9.11/vmlinux - Boot kernel
>>> c MINI2440 # bootm 0x30800000 - Kernel will stop at 0x30008200, step in assembly until MMU is enabled:
>>> monitor step target halted in ARM state due to single-step, current mode: Supervisor cpsr: 0x000000d3 pc: 0x300081e4 MMU: disabled, D-Cache: disabled, I-Cache: enabled >>> monitor step target halted in ARM state due to single-step, current mode: Supervisor cpsr: 0x000000d3 pc: 0x300081e8 MMU: enabled, D-Cache: enabled, I-Cache: enabled - Now set breakpoints to see what what happening just like we debugging U-Boot:
>>> tb slow_work_pending
Temporary breakpoint 2 at 0xc00082bc: file arch/arm/kernel/entry-common.S, line 104.
Booting kernel can be handled by U-Boot automatically if BOOT_COMMAND was defined, and the remaining part can be put into a handy script which can be sourced in gdb:
target extended-remote localhost:3333
monitor reset
monitor halt
load
tb _main
c
monitor load_image u-boot.img 0x337fffc0
monitor bp 0x30008200 4 hw
set confirm off
add-symbol-file ~/linux-5.9.11/vmlinux
c
monitor step
monitor step
monitor rbp all
tb slow_work_pending
This is not a REAL demonstration about how to find the root cause of the kernel issue, put all those here would make this too long, this is just serves as an introductory of how to use it, for a detailed version, see here.