
Reading Notes on Systems Performance
- Ch 1 Introduction
- Ch 2 Methodology
- Ch 3 Operating Systems
- Ch 4 Observability Tools
- Ch 5 Applications
- Ch 6 CPUs
- Ch 7 Memory
- Ch 8 File Systems
- Ch 9 Disks
Chapter 6 CPUs
6.1 Terminology
Hardware thread: a CPU architecture that supports executing multiple threads in parallel on a single core, where each thread is an independent CPU instance. One name for this scaling approach is multithreading.
6.2 Models
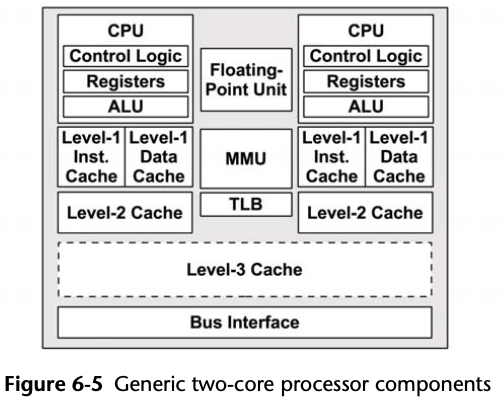
6.2.1 CPU Architecture
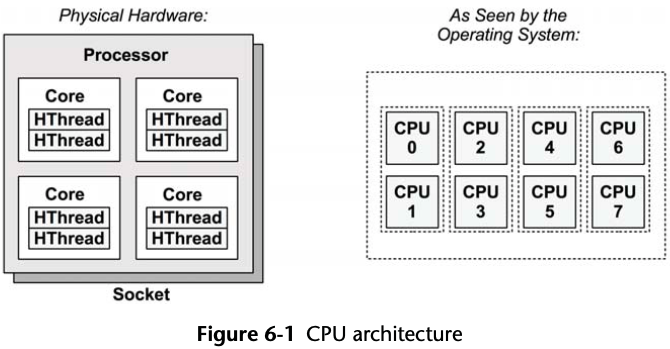 Each hardware thread is addressable as a logical CPU, so this processor appears
as eight CPUs. The operating system may have some additional knowledge of topology,
such as which CPUs are on the same core, to improve its scheduling decisions.
Each hardware thread is addressable as a logical CPU, so this processor appears
as eight CPUs. The operating system may have some additional knowledge of topology,
such as which CPUs are on the same core, to improve its scheduling decisions.
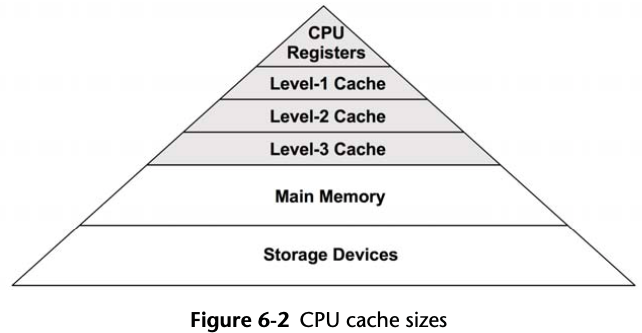
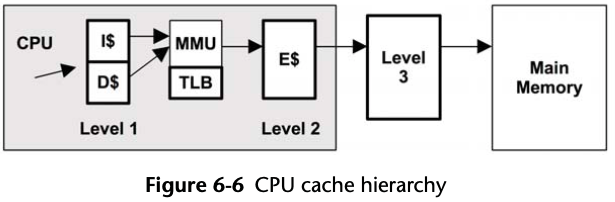
6.2.2 CPU Memory Caches
6.2.3 CPU Run Queues
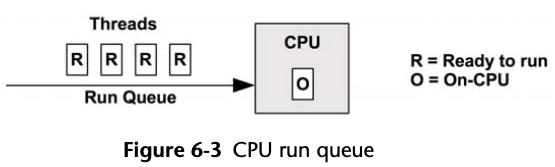
The time spent waiting on a CPU run queue is sometimes called
run-queue latency. In this book, the term scheduler
latency is used instead, as it is appropriate for all dispatcher types,
including those that do not use queues.
For multiprocessor systems, the kernel typically provides a run queue for each CPU and aims to keep threads on the same run queue. This means that threads are more likely to keep running on the same CPUs, where the CPU caches have cached their data. (These caches are described as having cache warmth, and the approach to favor CPUs is called CPU affinity.)
6.3 Concepts
6.3.1 Clock Rate
Even if the CPU in your system appears to be fully utilized (a bottleneck), a faster clock rate may not speed up performance—it depends on what those fast CPU cycles are actually doing. If they are mostly stall cycles while waiting on memory access, executing them more quickly doesn’t actually increase the CPU instruction rate or workload throughput.
6.3.2 Instruction
- Instruction fetch
- Instruction decode
- Execute
- Memory access
- Register write-back
The last two steps are optional, depending on the instruction.
Memory access is often the slowest, as it may take dozens of clock cycles to read or write to main memory, during which instruction execution has stalled (and these cycles while stalled are called stall cycles).
6.3.3 Instruction Pipeline
The instruction pipeline is a CPU architecture that can execute multiple instructions in parallel, by executing different components of different instructions at the same time.
6.3.4 Instruction Width
Modern processors are 3-wide or 4-wide, meaning they can complete up to three or four instructions per cycle.
According to this paper, the DENVER cpu (ARMv8) can execute 7 instructions per cycle.
6.3.5 CPI, IPC
CPI: Cycles per instruction
IPC: Instructions per cycle
A high CPI indicates that CPUs are often stalled, typically for memory access. A low CPI indicates that CPUs are often not stalled and have a high instruction throughput.
Memory-intensive workloads, for example, may be improved by:
- Installing faster memory (DRAM)
- Improving memory locality (software configuration)
- Reducing the amount of memory I/O
It should be noted that CPI shows the efficiency of instruction processing, but not of the instructions themselves.
6.3.6 Utilization
High CPU utilization may not necessarily be a problem, but rather a sign that the system is doing work. The measure of CPU utilization spans all clock cycles for eligible activities, including memory stall cycles. It may seem a little counterintuitive, but a CPU may be highly utilized because it is often stalled waiting for memory I/O, not just executing instructions.
6.3.7 User-Time/Kernel-Time
When measured across the entire system, the user-time/kernel-time ratio indicates the type of workload performed.
Applications that are computation-intensive may spend almost all their time executing user-level code and have a user/kernel ratio approaching 99/1. Examples include image processing, genomics, and data analysis.
Applications that are I/O-intensive have a high rate of system calls, which execute kernel code to perform the I/O. For example, a web server performing network I/O may have a user/kernel ratio of around 70/30.
6.3.8 Saturation
A CPU at 100% utilization is saturated, and threads will encounter scheduler latency as they wait to run on-CPU.
A CPU running at saturation is less of a problem than other resource types, as higher-priority work can preempt the current thread.
6.3.9 Preemption
Preemption allows a higher-priority thread to preempt the currently running thread and begin its own execution instead. This eliminates the run-queue latency for higher-priority work, improving its performance.
6.3.10 Priority Inversion
Priority inversion occurs when a lower-priority thread holds a resource and blocks a higher-priority thread from running. This reduces the performance of the higher-priority work, as it is blocked waiting.
6.3.11 Multiprocess, Multithreading
The degree to which the application can effectively scale with an increase in CPU count is a measure of scalability.
On Linux both the multiprocess and multithread models may be used, and both are implemented by tasks.
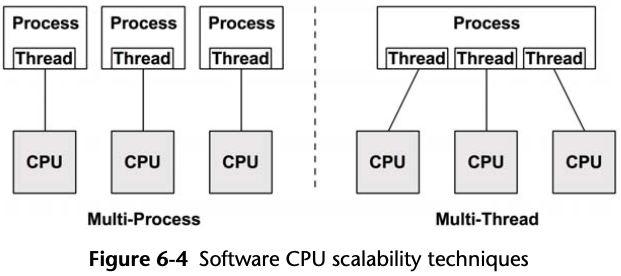
Table 6-1 Multiprocess and Multithreading Attributes
| Attribute | Multiprocess | Multithreading |
|---|---|---|
| Development | Can be easier. Use of fork(). | Use of threads API. |
| Memory overhead | Separate address space per process consumes some memory resources. | Small. Requires only extra stack and register space. |
| CPU overhead | Cost of fork()/exit(), which includes MMU work to manage address spaces. | Small. API calls. |
| Communication | Via IPC. This incurs CPU cost including context switching for moving data between address spaces, unless shared memory regions are used. | Fastest. Direct access to share memory. Integrity via synchronization primitives (e.g., mutex locks). |
| Memory usage | While some memory may be duplicated, separate processes can exit() and return all memory back to the system. | Via system allocator. This may incur some CPU contention from multiple threads, and fragmentation before memory is reused. |
6.3.12 Word Size
Processors are designed around a maximum word size—32-bit or 64-bit—which is the integer size and register size. Larger sizes can mean better performance, although it’s not as simple as it sounds. Larger sizes may cause memory overheads for unused bits in some data types. The data footprint also increases when the size of pointers (word size) increases, which can require more memory I/O.
For the x86 64-bit architecture, these overheads are compensated by an increase in registers and a more efficient register calling convention, so 64-bit applications will more likely be faster than their 32-bit versions.
6.3.12 Complier Optimization
The CPU runtime of applications can be significantly improved through compiler options (including setting word size) and optimizations. Compilers are also frequently updated to take advantage of the latest CPU instruction sets and to implement other optimizations. Sometimes application performance can be significantly improved simply by using a newer compiler.
6.4 Architecture
6.4.1 Hardware
CPU Caches
| core | L1 D$ | L1 I$ | L2 Cache |
|---|---|---|---|
| A53 | 64B / 4-way / PIPT / 8KB,16KB,32KB,64KB | 64B / 2-way / / 8KB,16KB,32KB,64KB | 64B / 16-way / PIPT / 128KB,256KB,512KB,1MB,2MB |
| A55 | 64B / 4-way / / 16KB,32KB,64KB / | 64B / 4-way / / 16KB,32KB,64KB | 64B / 4-way / PIPT / 64KB,128KB,256KB |
| A57 | 64B / 2-way / PIPT / 32KB / LRU | 64B / 3-way / PIPT / 48KB / LRU | 64B / 16-way / PIPT / 512KB,1MB,2MB / Random |
| A72 | 64B / 2-way / PIPT / 32 KB / LRU | 64B / 3-way / PIPT / 48 KB / LRU | 64B / 16-way / PIPT / 512KB,1MB,2MB,4MB |
| A73 | 64B / 4-way / VIPT / 32KB,64KB / R | 64B / 4-way / VIPT / 32KB,64KB / R | 64B / 16-way / PIPT / 256KB,512KB,1MB,2MB,4MB,8MB |
| A75 | 64B / 16-way / PIPT / 64 KB / R | 64B / 4-way / VIPT / 64 KB / R | 64B / 8-way / / 256KB,512KB |
PIPT: Physically-indexed and physically-tagged
VIPT: Virtually-indexed and physically-tagged
R: Pseudo-random
Latency
The access time for the Level 1 cache is typically a few CPU clock cycles, and for
the larger Level 2 cache around a dozen clock cycles. Main memory can take around
60 ns (around 240 cycles, for a 4 GHz processor), and address translation by the
MMU also adds latency.
Refer to 7-Zip LZMA Benchmark for benchmark data on different CPUs, an excerpt for Amlogic S905 as follows:
- L1 Data Cache Latency = 3 cycles for simple access via pointer
- L1 Data Cache Latency = 3 cycles for access with complex address calculation (size_t n, *p; n = p[n]).
- L2 Cache Latency = 15 cycles
- RAM Latency = 15 cycles + 128 ns
Associativity
Associativity is a cache characteristic describing a constraint for locating new
entries in the cache.
- Fully associative: The cache can locate new entries anywhere. For example, an LRU algorithm could evict the least recently used entry in the entire cache.
- Direct mapped: Each entry has only one valid location in the cache, for example, a hash of the memory address, using a subset of the address bits to form an address in the cache.
- Set associative: A subset of the cache is identified by mapping (e.g., hashing), from within which another algorithm (e.g., LRU) may be performed. It is described in terms of the subset size; for example, four-way set associative maps an address to four possible locations, and then picks the best from those four. Set associative mapping is a combination of direct mapping and fully associative mapping. It uses fully associative mapping within each set.
Cache Line
This is a range of bytes that are stored and transferred as a unit, improving memory
throughput. A typical cache line size is 64 bytes. Compilers take this into account
when optimizing for performance. Programmers sometimes do as well.
Cache Coherency
Memory may be cached in multiple CPU caches on different processors at the same
time. When one CPU modifies memory, all caches need to be aware that their cached
copy is now stale and should be discarded, so that any future reads will retrieve
the newly modified copy. This process, called cache coherency, ensures that CPUs
are always accessing the correct state of memory.
Further Reading
- Cache Memory in Computer Architecture
- Cache Mapping | Cache Mapping Techniques
- Set Associative Mapping | Set Associative Cache
- Cache Line | Cache Line Size | Cache Memory
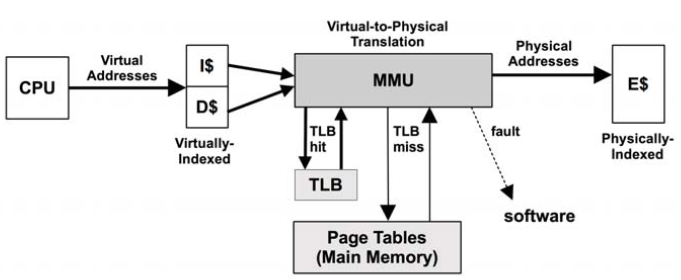
MMU
CPU Performance Counters
CPU performance counters (CPCs) go by many names, including performance instrumentation counters (PICs), performance monitoring unit (PMU), hardware events, and performance monitoring events. They are processor registers that can be programmed to count low-level CPU activity. They typically include counters for the following:
- CPU cycles: including stall cycles and types of stall cycles
- CPU instructions: retired (executed)
- Level 1, 2, 3 cache accesses: hits, misses
- Floating-point unit: operations
- Memory I/O: reads, writes, stall cycles
- Resource I/O: reads, writes, stall cycles
# perf list pmu
  armv8_pmuv3/br_immed_retired/                      [Kernel PMU event]
  armv8_pmuv3/br_mis_pred/                           [Kernel PMU event]
  armv8_pmuv3/br_pred/                               [Kernel PMU event]
  armv8_pmuv3/bus_access/                            [Kernel PMU event]
  armv8_pmuv3/bus_cycles/                            [Kernel PMU event]
  armv8_pmuv3/cid_write_retired/                     [Kernel PMU event]
  armv8_pmuv3/cpu_cycles/                            [Kernel PMU event]
  armv8_pmuv3/exc_return/                            [Kernel PMU event]
  armv8_pmuv3/exc_taken/                             [Kernel PMU event]
  armv8_pmuv3/inst_retired/                          [Kernel PMU event]
  armv8_pmuv3/l1d_cache/                             [Kernel PMU event]
  armv8_pmuv3/l1d_cache_refill/                      [Kernel PMU event]
  armv8_pmuv3/l1d_cache_wb/                          [Kernel PMU event]
  armv8_pmuv3/l1d_tlb_refill/                        [Kernel PMU event]
  armv8_pmuv3/l1i_cache/                             [Kernel PMU event]
  armv8_pmuv3/l1i_cache_refill/                      [Kernel PMU event]
  armv8_pmuv3/l1i_tlb_refill/                        [Kernel PMU event]
  armv8_pmuv3/l2d_cache/                             [Kernel PMU event]
  armv8_pmuv3/l2d_cache_refill/                      [Kernel PMU event]
  armv8_pmuv3/l2d_cache_wb/                          [Kernel PMU event]
  armv8_pmuv3/ld_retired/                            [Kernel PMU event]
  armv8_pmuv3/mem_access/                            [Kernel PMU event]
  armv8_pmuv3/memory_error/                          [Kernel PMU event]
  armv8_pmuv3/pc_write_retired/                      [Kernel PMU event]
  armv8_pmuv3/st_retired/                            [Kernel PMU event]
  armv8_pmuv3/sw_incr/                               [Kernel PMU event]
  armv8_pmuv3/unaligned_ldst_retired/                [Kernel PMU event]
[...]
6.4.2 Software
Scheduler
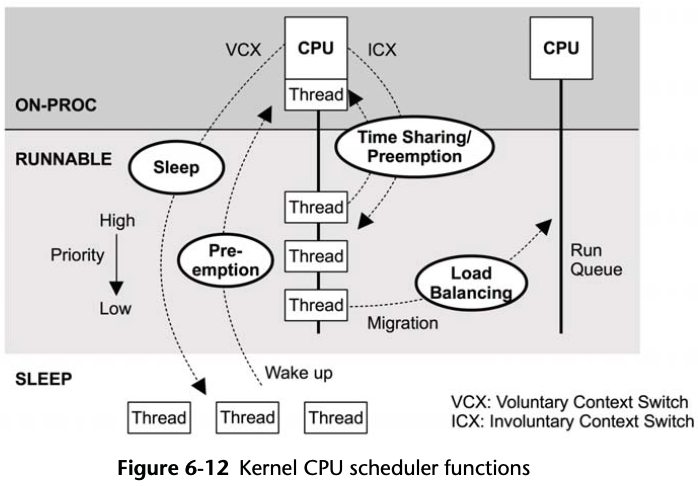
Time sharing is driven by the system timer interrupt by calling scheduler_tick(), which calls scheduler class functions to manage priorities and the expiry of units of CPU time called time slices. Preemption is triggered when threads become runnable and the scheduler class check_preempt_curr() function is called. Switching of threads is managed by __schedule(), which selects the highest-priority thread via pick_next_task() for running. Load balancing is performed by the load_balance() function.
Scheduling Classes
Scheduling classes manage the behavior of runnable threads, specifically their priorities, whether their on-CPU time is time-sliced, and the duration of those time slices (also known as time quantum). There are also additional controls via scheduling policies, which may be selected within a scheduling class and can control scheduling between threads of the same priority.
The priority of user-level threads is affected by a user-defined nice value, which can be set to lower the priority of unimportant work. In Linux, the nice value sets the static priority of the thread, which is separate from the dynamic priority that the scheduler calculates.
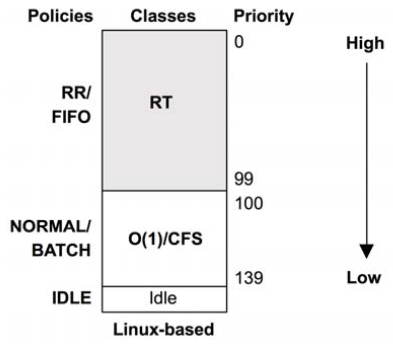
Figure 6-13 Thread scheduler priorities
- RT: provides fixed and high priorities for real-time workloads. The kernel supports both user- and kernel-level preemption, allowing RT tasks to be dispatched with low latency. The priority range is 0–99 (MAX_RT_PRIO–1).
- O(1): The O(1) scheduler is a time-sharing scheduler for user processes. The prior scheduler contained routines that iterated over all tasks, making it O(n), which became a scalability issue. The O(1) scheduler dynamically improves the priority of I/O-bound over CPU-bound workloads, to reduce latency of interactive and I/O workloads.
- CFS: Completely fair scheduling is the default time-sharing scheduler for user processes. The scheduler manages tasks on a red-black tree instead of traditional run queues, which is keyed from the task CPU time. This allows low CPU consumers to be easily found and executed in preference to CPU-bound workloads, improving the performance of interactive and I/O-bound workloads.
The scheduling class behavior can be adjusted by user-level processes by calling sched_setscheduler() to set the scheduler policy. The RT class supports the SCHED_RR and SCHED_FIFO policies, and the CFS class supports SCHED_ NORMAL and SCHED_BATCH.
- RR: SCHED_RR is round-robin scheduling. Once a thread has used its time slice, it is moved to the end of the run queue for that priority level, allowing others of the same priority to run.
- FIFO: SCHED_FIFO is first-in first-out scheduling, which continues running the thread at the head of the run queue until it voluntarily leaves, or until a higher -priority thread arrives. The thread continues to run, even if other threads of the same priority are on the run queue.
- NORMAL: SCHED_NORMAL (previously known as SCHED_OTHER) is time-sharing scheduling and is the default for user processes. The scheduler dynamically adjusts priority based on the scheduling class. For O(1), the time slice duration is set based on the static priority: longer durations for higher-priority work. For CFS, the time slice is dynamic.
- BATCH: SCHED_BATCH is similar to SCHED_NORMAL, but with the expectation that the thread will be CPU-bound and should not be scheduled to interrupt other I/O-bound interactive work.
Idle Thread
NUMA Grouping
6.5 Methodolog
Table 6-5 CPU Performance Methodologies
| Methodology | Types |
|---|---|
| Tools method | observational analysis |
| USE method | observational analysis |
| Workload characterization | observational analysis, capacity planning |
| Profiling | observational analysis |
| Cycle analysis | observational analysis |
| Performance monitoring | observational analysis, capacity planning |
| Static performance tuning | observational analysis, capacity planning |
| Priority tuning | tuning |
| Resource controls | tuning |
| CPU binding | tuning |
| Micro-benchmarking | experimental analysis |
| Scaling | capacity planning, tuning |
My suggestion is to use the following, in this order:
- performance monitoring
- the USE method
- profiling
- micro-benchmarking
- static analysis
6.5.1 Tools Method
- uptime: A load average over the number of CPUs in the system usually indicates saturation.
- vmstat: Run
vmstat 1, and check the idle columns to see how much headroom there is. Less than 10% can be a problem. - mpstat: Check for individual hot (busy) CPUs, identifying a possible thread scalability problem.
- top/prstat: See which processes and users are the top CPU consumers.
- pidstat/prstat: Break down the top CPU consumers into user- and system-time.
- perf/dtrace/stap/oprofile: Profile CPU usage stack traces for either user- or kernel-time, to identify why the CPUs are in use.
- perf/cpustat: Measure CPI.
6.5.2 USE Method
- Utilization: the time the CPU was busy (not in the idle thread)
- Saturation: the degree to which runnable threads are queued waiting their turn on-CPU
- Errors: CPU errors, including correctable errors
6.5.3 Workload Characterization
Basic attributes for characterizing CPU workload are
- Load averages (utilization + saturation)
- User-time to system-time ratio
- Syscall rate
- Voluntary context switch rate
- Interrupt rate
I/O-bound workloads have higher system-time, syscalls, and also voluntary context switches as threads block waiting for I/O.
Advanced Workload Characterization/Checklist:
- What is the CPU utilization system-wide? Per CPU?
- How parallel is the CPU load? Is it single-threaded? How many threads?
- Which applications or users are using the CPUs? How much?
- Which kernel threads are using the CPUs? How much?
- What is the CPU usage of interrupts?
- What is the CPU interconnect utilization?
- Why are the CPUs being used (user- and kernel-level call paths)?
- What types of stall cycles are encountered?
6.5.4 Profiling
6.5.5 Cycle Analysis
This may reveal that cycles are spent stalled on Level 1, 2, or 3 cache misses, memory I/O, or resource I/O, or spent on floating-point operations or other activity. This information may lead to performance wins by adjusting compiler options or changing the code.
Begin cycle analysis by measuring CPI. If CPI is high, continue to investigate types of stall cycles. If CPI is low, look for ways in the code to reduce instructions performed.
The values for “high” or “low” CPI depend on your processor: low could be less than one, and high could be greater than ten.
6.5.6 Performance Monitoring
Per-second measurements are preferable, but you should be aware that there can be bursts even within a second. These can be identified from saturation.
6.5.7 Static Performance Tuning
- How many CPUs are available for use? Are they cores? Hardware threads?
- Is the CPU architecture single- or multiprocessor?
- What is the size of the CPU caches? Are they shared?
- What is the CPU clock speed? Is it dynamic?
- What other CPU-related features are enabled or disabled?
- Are there performance issues (bugs) with this processor model? Are they listed in the processor errata sheet?
- Are there performance issues (bugs) with this BIOS firmware version?
- Are there software-imposed CPU usage limits (resource controls) present? What are they?
6.5.8 Priority Tuning
Positive nice values result in lower process priority (nicer), and negative values —which can be set only by the superuser (root)—result in higher priority.
Linux kernel includes a real-time scheduling class, which can allow processes to preempt all other work. While this can eliminate scheduler latency (other than for other real-time processes and interrupts), make sure you understand the consequences. If the real-time application encounters a bug where multiple threads enter an infinite loop, it can cause all CPUs to become unavailable for all other work — including the administrative shell required to manually fix the problem.
6.5.9 Resource Controls
6.5.10 CPU Binding
Another way to tune CPU performance involves binding processes and threads to individual CPUs, or collections of CPUs. This can increase CPU cache warmth for the process, improving its memory I/O performance. For NUMA systems it also improves memory locality, also improving performance.
There are generally two ways this is performed:
- Process binding: configuring a process to run only on a single CPU, or only on one CPU from a defined set.
- Exclusive CPU sets: partitioning a set of CPUs that can be used only by the process(es) assigned to them. This can improve CPU cache further, as when the process is idle other processes cannot use the CPUs, leaving the caches warm.
The exclusive CPU sets approach can be implemented using cpusets.
6.5.11 Micro-Benchmarking
Micro-benchmarking typically measure the time taken to perform a simple operation many times. The operation may be based on the following:
- CPU instructions: integer arithmetic, floating-point operations, memory loads and stores, branch and other instructions
- Memory access: to investigate latency of different CPU caches and main memory throughput
- Higher-level languages: similar to CPU instruction testing, but written in a higher-level interpreted or compiled language
- Operating system operations: testing system library and system call functions that are CPU-bound, such as getpid() and process creation
Dhrystone: simulate integer workloads of the time
When comparing results between systems it’s important that you understand what is really being tested. Benchmarks often end up testing compiler optimizations between different compiler versions, rather than the benchmark code or CPU speed. Many benchmarks also execute single-threaded, but these results lose meaning in systems with multiple CPUs. A four-CPU system may benchmark slightly faster than an eight-CPU system, but the latter is likely to deliver much greater throughput when given enough parallel runnable threads.
6.5.12 Scaling
6.6 Analysis
Table 6-6 CPU Analysis Tools
| Linux | Description |
|---|---|
| uptime | load averages |
| vmstat | includes system-wide CPU averages |
| mpstat | per-CPU statistics |
| sar | historical statistics |
| ps | process status |
| top | monitor per-process/thread CPU usage |
| pidstat | per-process/thread CPU breakdowns |
| time | time a command, with CPU breakdowns |
| DTrace, perf | CPU profiling and tracing |
| perf | CPU performance counter analysis |
6.6.1 uptime
Linux currently adds tasks performing disk I/O in the uninterruptable state to the load averages. This means that the load average can no longer be interpreted to mean CPU headroom or saturation only, since it is unknown from the value alone to what degree it reflects CPU or disk load.
6.6.2 vmstat
# vmstat 1 -w
procs -----------------------memory---------------------- ---swap-- -----io---- -system-- --------cpu--------
 r  b         swpd         free         buff        cache   si   so    bi    bo   in   cs  us  sy  id  wa  st
 0  0            0       325288        90884      1146872    0    0     1     1    5    5   0   0  99   0   0
 0  0            0       325288        90884      1146872    0    0     0     0  309  257   0   0 100   0   0
 0  0            0       325288        90884      1146872    0    0     0     0  296  264   0   0 100   0   0
- r: run-queue length – the total number of runnable threads, an “r” value greater than the CPU count is saturation.
- wa: wait I/O, which measures CPU idle when threads are blocked on disk I/O
The r column is the total number of tasks waiting plus those running.
6.6.3 mpstat
The multiprocessor statistics tool, mpstat, can report statistics per CPU.
$ mpstat -P ALL 1
[...]
03:16:41 AM     CPU    %usr   %nice    %sys %iowait    %irq   %soft  %steal  %guest  %gnice   %idle
03:16:42 AM     all   14.27    0.00    0.75    0.44    0.00    0.00    0.06    0.00    0.00   84.48
03:16:42 AM       0  100.00    0.00    0.00    0.00    0.00    0.00    0.00    0.00    0.00    0.00
[...]
Key columns are %usr, %sys, and %idle. These identify CPU usage per CPU and show the user-time/kernel-time ratio. This can also identify “hot” CPUs—those running at 100% utilization (%usr + %sys) while others are not—which can be caused by single-threaded application workloads or device interrupt mapping.
6.6.4 sar
# sar -uq 1
Linux 4.18.0-virtual (...) 01/21/2019 _x86_64_ (36 CPU)

11:06:25 PM     CPU     %user     %nice   %system   %iowait    %steal     %idle
11:06:26 PM     all     88.06      0.00     11.94      0.00      0.00      0.00

11:06:25 PM   runq-sz  plist-sz   ldavg-1   ldavg-5  ldavg-15   blocked
11:06:26 PM        72      1030     65.90     41.52     34.75         0
[...]
- -u: show CPU utilization
- -q: includes run-queue size as runq-sz (waiting plus running, same as vmstat’s r) and load averages
6.6.5 ps
ps has two different option styles: BSD (without dash before options) and SVR4 ( preceded by a dash)
# BSD
ps aux

# SVR4
ps -ef
The TIME column shows the total CPU time consumed by the process (user + system) since it was created, in hours:minutes:seconds.
The %CPU column shows the CPU usage during the previous second as the sum across all CPUs. A single-threaded CPU-bound process will report 100%. A two-thread CPU-bound process will report 200%.
6.6.6 top
top - 02:25:10 up  1:54,  1 user,  load average: 0.00, 0.00, 0.00
Tasks: 176 total,   1 running, 175 sleeping,   0 stopped,   0 zombie
%Cpu(s):  0.0 us,  0.1 sy,  0.0 ni, 99.8 id,  0.0 wa,  0.0 hi,  0.0 si,  0.0 st
MiB Mem :   1731.0 total,   1188.0 free,    157.5 used,    385.6 buff/cache
MiB Swap:      0.0 total,      0.0 free,      0.0 used.   1354.8 avail Mem

    PID USER      PR  NI    VIRT    RES    SHR S  %CPU  %MEM     TIME+ COMMAND
   3160 fdbai     20   0    8952   3092   2664 R   1.6   0.2   0:00.23 top
   2530 root      20   0       0      0      0 I   0.3   0.0   0:00.68 kworker/u16:1-events_power_efficient
      1 root      20   0  167064  10336   7548 S   0.0   0.6   0:34.13 systemd
      2 root      20   0       0      0      0 S   0.0   0.0   0:00.06 kthreadd
      3 root       0 -20       0      0      0 I   0.0   0.0   0:00.00 rcu_gp
      4 root       0 -20       0      0      0 I   0.0   0.0   0:00.00 rcu_par_gp
      8 root       0 -20       0      0      0 I   0.0   0.0   0:00.00 mm_percpu_wq
      9 root      20   0       0      0      0 S   0.0   0.0   0:00.24 ksoftirqd/0
TIME+ column, which is same as the one in ps, but at a resolution of hundredths of a second.
%CPU column by default is not normalized by CPU count; top(1) calls this “Irix mode”, after its behavior on IRIX.
You should be aware that the CPU usage of top itself can become significant and place top as the top CPU-consuming process! This has been due to the available system calls—open(), read(), close()—and their cost when iterating over /proc entries for many processes. A variant of top for Linux, called atop, uses process accounting to catch the presence of short-lived processes, which it includes in its display.
6.6.8 pidstat
pidstat prints CPU usage by process or thread, including user- and system-time breakdowns. By default, a rolling output is printed of only active processes.
$ pidstat 1
Linux 5.7.8+ (arm-64) 	09/09/2020 	_aarch64_	(8 CPU)

03:28:26 AM   UID       PID    %usr %system  %guest   %wait    %CPU   CPU  Command
03:28:27 AM     0         1    2.00    1.00    0.00    0.00    3.00     2  systemd
03:28:27 AM     0       738    1.00    1.00    0.00    1.00    2.00     1  systemd-journal
03:28:27 AM   104       793    1.00    0.00    0.00    0.00    1.00     3  dbus-daemon
03:28:27 AM     0       819    1.00    0.00    0.00    0.00    1.00     3  rsyslogd
03:28:27 AM     0       827    0.00    1.00    0.00    0.00    1.00     0  systemd-logind
03:28:27 AM     0      3952    0.00    1.00    0.00    0.00    1.00     3  kworker/u16:0-events_power_efficient
03:28:27 AM  1000      4281    2.00    5.00    0.00    0.00    7.00     4  pidstat
03:28:27 AM     0      4282    0.00    1.00    0.00    0.00    1.00     5  agetty
[...]
The -p ALL option can be used to print all processes, including those that are idle. -t prints per-thread statistics.
6.6.9 time
$ time md5sum Armbian.img.xz
8ee39aa97791e57fb4fc9a7d38579913  Armbian.img.xz

real	0m11.299s
user	0m2.526s
sys	0m1.470s
$ time md5sum Armbian.img.xz
8ee39aa97791e57fb4fc9a7d38579913  Armbian.img.xz

real	0m3.453s
user	0m2.931s
sys	0m0.480s
There is a missing 7.3 s (11.30 - 2.53 - 1.47), which is likely time spent blocked on disk I/O reads, as this file was only partially cached. The second run completed more quickly, in 3.5 s, with almost no time blocked on I/O.
The /usr/bin/time version supports verbose details:
$ sudo apt install time
$ /usr/bin/time -v md5sum Armbian.img.xz
8ee39aa97791e57fb4fc9a7d38579913  Armbian.img.xz
	Command being timed: "md5sum Armbian.img.xz"
	User time (seconds): 2.52
	System time (seconds): 1.50
	Percent of CPU this job got: 35%
	Elapsed (wall clock) time (h:mm:ss or m:ss): 0:11.26
	Average shared text size (kbytes): 0
	Average unshared data size (kbytes): 0
	Average stack size (kbytes): 0
	Average total size (kbytes): 0
	Maximum resident set size (kbytes): 1724
	Average resident set size (kbytes): 0
	Major (requiring I/O) page faults: 1
	Minor (reclaiming a frame) page faults: 89
	Voluntary context switches: 4499
	Involuntary context switches: 3099
	Swaps: 0
	File system inputs: 777912
	File system outputs: 0
	Socket messages sent: 0
	Socket messages received: 0
	Signals delivered: 0
	Page size (bytes): 4096
	Exit status: 0
There are many Voluntary context switches which means I/O, there is only one in the second run.
6.6.10 dtrace
6.6.11 sytemtap
6.6.12 perf
Table 6-8 perf Subcommands
| Command | Description |
|---|---|
| annotate | Read perf.data (created by perf record) and display annotated code. |
| diff | Read two perf.data files and display the differential profile. |
| evlist | List the event names in a perf.data file. |
| inject | Filter to augment the events stream with additional information. |
| kmem | Tool to trace/measure kernel memory (slab) properties. |
| kvm | Tool to trace/measure kvm guest OS. |
| list | List all symbolic event types. |
| lock | Analyze lock events. |
| probe | Define new dynamic tracepoints. |
| record | Run a command and record its profile into perf.data. |
| report | Read perf.data (created by perf record) and display the profile. |
| sched | Tool to trace/measure scheduler properties (latencies). |
| script | Read perf.data (created by perf record) and display trace output. |
| stat | Run a command and gather performance counter statistics. |
| timechart | Tool to visualize total system behavior during a workload. |
| top | System profiling tool. |
System Profiling
perf can be used to profile CPU call paths, summarizing where CPU time is spent in both kernel- and user-space.
# perf record -a -g -F 997 sleep 10
[ perf record: Woken up 10 times to write data ]
[ perf record: Captured and wrote 3.163 MB perf.data (28752 samples) ]

# perf report --stdio
[...]
# Children      Self  Command          Shared Object             Symbol
# ........  ........  ...............  ........................  .......................................
#
    99.38%     0.00%  swapper          [kernel.kallsyms]         [k] cpu_startup_entry
            |
            ---cpu_startup_entry
               do_idle
               |
                --99.33%--default_idle_call
                          arch_cpu_idle
Process Profiling
# perf record -g command
Scheduler Latency
# perf sched record sleep 10
[ perf record: Woken up 1 times to write data ]
[ perf record: Captured and wrote 0.336 MB perf.data (1746 samples) ]
# perf sched latency

 -----------------------------------------------------------------------------------------------------------------
  Task                  |   Runtime ms  | Switches | Average delay ms | Maximum delay ms | Maximum delay at       |
 -----------------------------------------------------------------------------------------------------------------
  kworker/7:2-mm_:6900  |      1.150 ms |       10 | avg:    0.193 ms | max:    0.944 ms | max at:  22800.364209 s
  kworker/6:1-mm_:6264  |      0.108 ms |        5 | avg:    0.158 ms | max:    0.618 ms | max at:  22803.659853 s
  kworker/1:1-eve:6885  |      0.823 ms |       20 | avg:    0.078 ms | max:    1.252 ms | max at:  22800.501874 s
  kworker/5:0-eve:6401  |      0.014 ms |        1 | avg:    0.053 ms | max:    0.053 ms | max at:  22800.479311 s
  kworker/4:0-eve:6897  |      0.747 ms |       11 | avg:    0.050 ms | max:    0.073 ms | max at:  22801.323293 s
  kworker/3:0-eve:6809  |      0.120 ms |        5 | avg:    0.050 ms | max:    0.132 ms | max at:  22800.275106 s
  khugepaged:64         |      0.030 ms |        1 | avg:    0.048 ms | max:    0.048 ms | max at:  22805.963197 s
  perf_5.7:(2)          |      6.241 ms |       11 | avg:    0.048 ms | max:    0.089 ms | max at:  22804.920530 s
  kworker/0:1-eve:6876  |      1.129 ms |       55 | avg:    0.047 ms | max:    0.115 ms | max at:  22800.831348 s
  jbd2/mmcblk1p2-:302   |      0.861 ms |        3 | avg:    0.045 ms | max:    0.048 ms | max at:  22803.661044 s
  ksoftirqd/1:16        |      0.040 ms |        3 | avg:    0.045 ms | max:    0.064 ms | max at:  22803.659375 s
  kworker/7:0-eve:6433  |      2.279 ms |       27 | avg:    0.043 ms | max:    0.334 ms | max at:  22800.363582 s
  irq/24-d0074000:206   |      0.000 ms |        2 | avg:    0.038 ms | max:    0.049 ms | max at:  22803.659890 s
  kworker/0:2H-kb:6540  |      0.168 ms |        3 | avg:    0.034 ms | max:    0.049 ms | max at:  22805.707201 s
  kworker/u16:0-e:6416  |      4.590 ms |       91 | avg:    0.034 ms | max:    0.126 ms | max at:  22802.187358 s
  ksoftirqd/7:46        |      0.474 ms |        3 | avg:    0.033 ms | max:    0.061 ms | max at:  22800.307379 s
  gmain:924             |      0.351 ms |        2 | avg:    0.031 ms | max:    0.033 ms | max at:  22801.731916 s
Scheduler events are frequent, so this type of tracing incurs CPU and storage overhead.
DTrace summarize data while tracing and pass only the summary to user-space, minimizing overhead.
stat
# perf stat gzip file1

 Performance counter stats for 'gzip file1':

          5,260.87 msec task-clock                #    0.844 CPUs utilized
                25      context-switches          #    0.005 K/sec
                 0      cpu-migrations            #    0.000 K/sec
               119      page-faults               #    0.023 K/sec
     7,448,948,841      cycles                    #    1.416 GHz
     5,324,361,482      instructions              #    0.71  insn per cycle
       579,601,280      branches                  #  110.172 M/sec
        44,687,539      branch-misses             #    7.71% of all branches

       6.232733314 seconds time elapsed

       4.854584000 seconds user
       0.352224000 seconds sys
$ perf list
List of pre-defined events (to be used in -e):

  branch-instructions OR branches                    [Hardware event]
  branch-misses                                      [Hardware event]
  bus-cycles                                         [Hardware event]
  cache-misses                                       [Hardware event]
  cache-references                                   [Hardware event]
  cpu-cycles OR cycles                               [Hardware event]
  instructions                                       [Hardware event]
[...]
  L1-dcache-load-misses                              [Hardware cache event]
  L1-dcache-loads                                    [Hardware cache event]
  L1-dcache-prefetch-misses                          [Hardware cache event]
  L1-icache-load-misses                              [Hardware cache event]
  L1-icache-loads                                    [Hardware cache event]
  branch-load-misses                                 [Hardware cache event]
  branch-loads                                       [Hardware cache event]
  dTLB-load-misses                                   [Hardware cache event]
  iTLB-load-misses                                   [Hardware cache event]
  node-loads                                         [Hardware cache event]
  node-stores                                        [Hardware cache event]
[...]
# perf stat -e instructions,cycles,L1-dcache-load-misses,dTLB-load-misses gzip file1

 Performance counter stats for 'gzip file1':

     5,273,961,198      instructions              #    0.74  insn per cycle
     7,127,661,949      cycles
        72,706,083      L1-dcache-load-misses
            34,677      dTLB-load-misses

       5.150305180 seconds time elapsed

       4.779827000 seconds user
       0.307697000 seconds sys
- L1-dcache-load-misses: Level 1 data cache load misses. This gives you a measure of the memory load caused by the application, after some loads have been returned from the Level 1 cache. It can be compared with other L1 event counters to determine cache hit rate.
- dTLB-load-misses: Data translation lookaside buffer misses. This shows the effectiveness of the MMU to cache page mappings for the workload and can measure the size of the memory workload (working set).
Software Tracing
$ perf list
[...]
  alignment-faults                                   [Software event]
  bpf-output                                         [Software event]
  context-switches OR cs                             [Software event]
  cpu-clock                                          [Software event]
  cpu-migrations OR migrations                       [Software event]
  dummy                                              [Software event]
  emulation-faults                                   [Software event]
  major-faults                                       [Software event]
  minor-faults                                       [Software event]
  page-faults OR faults                              [Software event]
  task-clock                                         [Software event]
[...]
# perf record -g -a -e cs gzip file1
[ perf record: Woken up 1 times to write data ]
[ perf record: Captured and wrote 0.159 MB perf.data (118 samples) ]

# perf report --stdio
[...]
# Samples: 118  of event 'cs'
# Event count (approx.): 337
#
# Children      Self  Command          Shared Object             Symbol
# ........  ........  ...............  ........................  .............................................
#
    45.70%    45.70%  swapper          [kernel.kallsyms]         [k] schedule_idle
            |
            |--37.09%--secondary_start_kernel
            |          cpu_startup_entry
            |          do_idle
            |          schedule_idle
            |          schedule_idle
            |
             --8.61%--start_kernel
                       arch_call_rest_init
                       rest_init
                       cpu_startup_entry
                       do_idle
                       schedule_idle
6.6.14 Other Tools
- oprofile: the original CPU profiling tool by John Levon.
- htop: includes ASCII bar charts for CPU usage and has a more powerful interactive interface than the original top.
- atop: includes many more system-wide statistics and uses process accounting to catch the presence of short-lived processes.
- /proc/cpuinfo: This can be read to see processor details, including clock speed and feature flags.
- getdelays.c: This is an example of delay accounting observability and includes CPU scheduler latency per process.
- valgrind: a memory debugging and profiling toolkit. It contains callgrind, a tool to trace function calls and gather a call graph, which can be visualized using kcachegrind; and cachegrind for analysis of hardware cache usage by a given program.
6.6.15 Visualizations
Utilization Heat Map
Subsecond-Offset Heat Map
What is interesting about this heat map isn’t the times that the CPUs were busy servicing the database, but the times that they were not, indicated by the white columns. The duration of these gaps was also interesting: hundreds of milliseconds during which none of the database threads were on-CPU. This led to the discovery of a locking issue where the entire database was blocked for hundreds of milliseconds at a time.
Flame Graphs
- The top box shows the function that was on-CPU.
- The width of the box shows the total time it was on-CPU or part of an ancestry that was on-CPU (based on sample count). Wider box functions may be slower than narrow box functions, or they may simply be called more often.
6.7 Experimentation
When using these tools, it’s a good idea to leave mpstat continually running
to confirm CPU usage and parallelism.
6.7.1 Ad Hoc
This creates a single-threaded workload that is CPU-bound (“hot on one CPU”):
# while :; do :; done
6.7.2 Sysbench
6.8 Tuning
6.8.1 Compiler Options
6.8.2 Scheduling Priority and Class
The nice command can be used to adjust process priority. The range is from -20
to +19.
The chrt command can show/set the scheduling priority directly, and the scheduling
policy.
The scheduling priority can also be set directly using the setpriority() syscall,
and the priority and scheduling policy can be set using the sched_setscheduler()
syscall.
$ chrt -p 819
pid 819's current scheduling policy: SCHED_OTHER
pid 819's current scheduling priority: 0
6.8.3 Scheduler Options
Table 6-9 Linux Scheduler Config Options
| Option | Default | Description |
|---|---|---|
| CONFIG_CGROUP_SCHED | y | allows tasks to be grouped, allocating CPU time on a group basis |
| CONFIG_FAIR_GROUP_SCHED | y | allows CFS tasks to be grouped |
| CONFIG_RT_GROUP_SCHED | y | allows real-time tasks to be grouped |
| CONFIG_SCHED_AUTOGROUP | y | automatically identifies and creates task groups (e.g., build jobs) |
| CONFIG_SCHED_MC | y | hyperthreading support |
| CONFIG_SCHED_SMT | y | multicore support |
| CONFIG_HZ | 1,000 | sets kernel clock rate (timer interrupt) |
| CONFIG_NO_HZ | y | tickless kernel behavior |
| CONFIG_SCHED_HRTICK | y | use high-resolution timers |
| CONFIG_PREEMPT | n | full kernel preemption (exception of spin lock regions and interrupts) |
| CONFIG_PREEMPT_NONE | n | no preemption |
| CONFIG_PREEMPT_VOLUNTARY | y | preemption at voluntary kernel code points |
6.8.4 Process Binding
A process may be bound to one or more CPUs, which may increase its performance by
improving cache warmth and memory locality.
This is performed using the taskset command, which can use a CPU mask or ranges
to set CPU affinity.
# taskset -pc 5-7 738
pid 738's current affinity list: 0-7
pid 738's new affinity list: 5-7
6.8.5 Exclusive CPU Sets
cpusets allow CPUs to be grouped and processes assigned to them. This can improve performance similarly to process binding, but performance can be improved further by making the cpuset exclusive—preventing other processes from using it.
6.8.6 Resource Controls
There are container groups (cgroups), which can also control resource usage by processes or groups of processes. CPU usage can be controlled using shares, and the CFS scheduler allows fixed limits to be imposed (CPU bandwidth), in terms of allocating microseconds of CPU cycles per interval.
6.9 Exercises
- Answer the following questions about CPU terminology:
- What is the difference between a process and a processor?
- What is a hardware thread?
- What is the run queue (also called a dispatcher queue)?
- What is the difference between user-time and kernel-time?
- What is CPI?
- Answer the following conceptual questions:
- Describe CPU utilization and saturation.
- Describe how the instruction pipeline improves CPU throughput.
- Describe how processor instruction width improves CPU throughput.
- Describe the advantages of multiprocess and multithreaded models.
- Answer the following deeper questions:
- Describe what happens when the system CPUs are overloaded with runnable work, including the effect on application performance.
- When there is no runnable work to perform, what do the CPUs do?
- When handed a suspected CPU performance issue, name three methodologies you would use early during the investigation, and explain why.
- Develop the following procedures for your operating system:
- A USE method checklist for CPU resources. Include how to fetch each metric (e.g., which command to execute) and how to interpret the result. Try to use existing OS observability tools before installing or using additional software products.
- A workload characterization checklist for CPU resources. Include how to fetch each metric, and try to use existing OS observability tools first.
- Perform these tasks:
- Calculate the load average for the following system, whose load is at steady
state:
- The system has 64 CPUs.
- The system-wide CPU utilization is 50%.
- The system-wide CPU saturation, measured as the total number of runnable and queued threads on average, is 2.0.
- Choose an application, and profile its user-level CPU usage. Show which code paths are consuming the most CPU.
- Calculate the load average for the following system, whose load is at steady
state:
- (optional, advanced) Develop bustop—a tool that shows physical bus or interconnect utilization—with a presentation similar to iostat: a list of busses, columns for throughput in each direction, and utilization. Include saturation and error metrics if possible. This will require using CPC.
Chapter 7 Memory
7.1 Terminology
7.2 Concepts
7.2.1 Virtual Memory
Virtual memory was introduced in Chapter 3, Operating Systems.
7.2.2 Paging
Paging is the movement of pages in and out of main memory, which are referred to as page-ins and page-outs respectively.
File System Paging
It has been referred to as good paging.
Anonymous Paging
Anonymous page-outs require moving the data to the physical swap devices or swap files, a.k.a swapping.
Anonymous paging hurts performance and has therefore been referred to as bad paging.
Performance is best when there is no anonymous paging (or swapping). This can be achieved by configuring applications to remain within the main memory available and by monitoring page scanning, memory utilization, and anonymous paging, to ensure that there are no longer indicators of a memory shortage.
7.2.3 Demand Paging
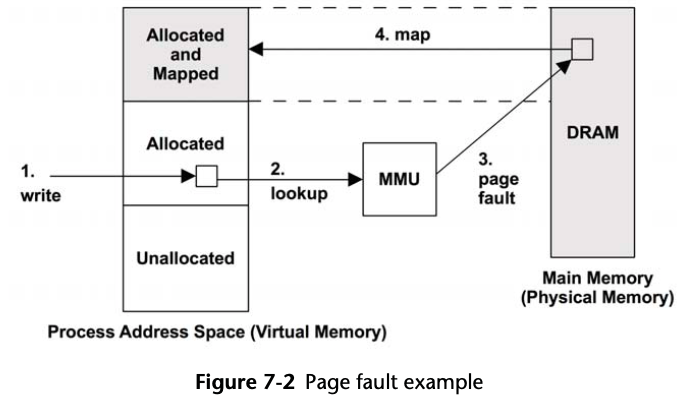
Minor fault: If the mapping can be satisfied from another page in memory.
Major fault: Page fault that requires storage device access, such as accessing an uncached memory-mapped file.
Any page of virtual memory may be in one of the following states:
A. Unallocated
B. Allocated, but unmapped (unpopulated and not yet faulted)
C. Allocated, and mapped to main memory (RAM)
D. Allocated, and mapped to the physical swap device (disk)
State (D) is reached if the page is paged out due to system memory pressure. A transition from (B) to (C) is a page fault. If it requires disk I/O, it is a major page fault; otherwise, a minor page fault.
- Resident set size (RSS): the size of allocated main memory pages (C)
- Virtual memory size: the size of all allocated areas (B + C + D)
7.2.4 Overcommit
Overcommit allows more memory to be allocated than the system can possibly store — more than physical memory and swap devices combined.
The behavior of overcommit can be configured with these vm parameters:
vm.nr_overcommit_hugepages = 0
vm.overcommit_kbytes = 0
vm.overcommit_memory = 0
vm.overcommit_ratio = 50
7.2.5 Swapping
Processes that are swapped out are still known by the kernel, as a small amount of process metadata is always resident in kernel memory.
Swapping severely hurts performance, as a process that has been swapped out requires numerous disk I/O to run again.
Linux systems do not swap processes at all and rely only on paging.
When people say, “The system is swapping,” they usually mean it is paging.
On Linux, the term swapping refers to paging to the swap file or device (anonymous paging).
7.2.6 File System Cache Usage
7.2.7 Utilization and Saturation
If demands for memory exceed the amount of main memory, main memory becomes saturated.
The operating system may then free memory by employing paging, swapping, and, on Linux, the OOM killer. Any of these activities is an indicator of main memory saturation.
7.2.8 Allocators
7.2.9 Word Size
Processors may support multiple word sizes, such as 32-bit and 64-bit.
Memory performance may be improved by using larger bit widths depending on the CPU architecture. A small amount of memory may be wasted, in cases where a data type has unused bits at the larger bit width.
7.3 Architecture
7.3.1 Hardware
Main Memory
Latency
The access time of main memory can be measured as the column address strobe (CAS) latency: the time between sending a memory module the desired address (column) and when the data is available to be read.
For DDR3 it is around 10 ns
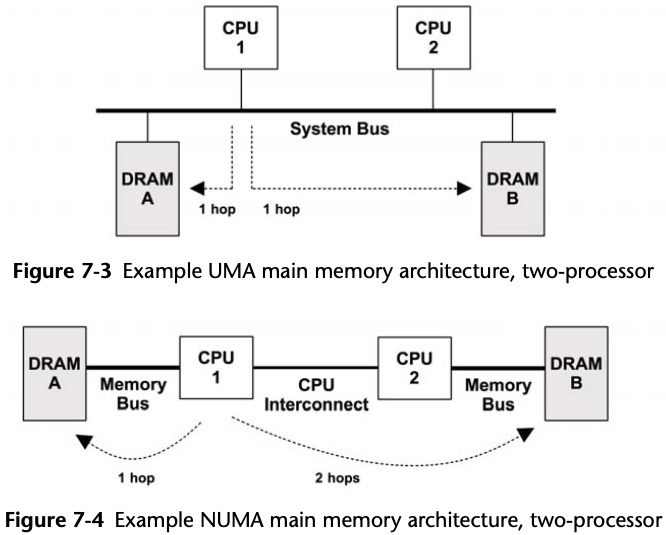
Main Memory Architecture
Busses
DDR SDRAM
The speed of the memory bus, for any architecture, is often dictated by the memory interface standard supported by the processor and system board.
Table 7-1 Example DDR Bandwidths
| Standard | Memory Clock (MHz) | Data Rate (MT/s) | Peak Bandwidth (MB/s) |
|---|---|---|---|
| DDR-200 | 100 | 200 | 1,600 |
| DDR-333 | 167 | 333 | 2,667 |
| DDR2-667 | 167 | 667 | 5,333 |
| DDR2-800 | 200 | 800 | 6,400 |
| DDR3-1333 | 167 | 1,333 | 10,667 |
| DDR3-1600 | 200 | 1,600 | 12,800 |
| DDR4-3200 | 200 | 3,200 | 25,600 |
Multichannel
System architectures may support the use of multiple memory busses in parallel, to improve bandwidth. Common multiples are dual-, triple-, and quad-channel.
perf
$ perf bench mem all
# Running mem/memcpy benchmark...
# function 'default' (Default memcpy() provided by glibc)
# Copying 1MB bytes ...

       2.341876 GB/sec

# Running mem/memset benchmark...
# function 'default' (Default memset() provided by glibc)
# Copying 1MB bytes ...

       2.712674 GB/sec
mbw
$ sudo apt install mbw
$ mbw 32 | grep AVG
AVG	Method: MEMCPY	Elapsed: 0.02137	MiB: 32.00000	Copy: 1497.510 MiB/s
AVG	Method: DUMB	Elapsed: 0.02047	MiB: 32.00000	Copy: 1563.095 MiB/s
AVG	Method: MCBLOCK	Elapsed: 0.01087	MiB: 32.00000	Copy: 2944.966 MiB/s

$ mbw -b 4096 32 | grep AVG
AVG	Method: MEMCPY	Elapsed: 0.02107	MiB: 32.00000	Copy: 1519.043 MiB/s
AVG	Method: DUMB	Elapsed: 0.02041	MiB: 32.00000	Copy: 1567.813 MiB/s
AVG	Method: MCBLOCK	Elapsed: 0.00711	MiB: 32.00000	Copy: 4503.490 MiB/s
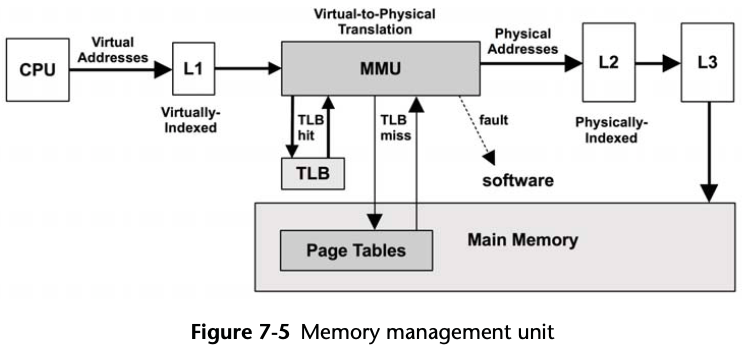
CPU Caches
MMU
Multiple Page Sizes
Linux has a feature called huge pages, which sets aside a portion of physical memory for use with a particular large page size, such as 2 Mbytes.
It also avoids a problem of memory fragmentation preventing larger pages being dynamically allocated.
TLB
7.3.2 Software
Freeing Memory
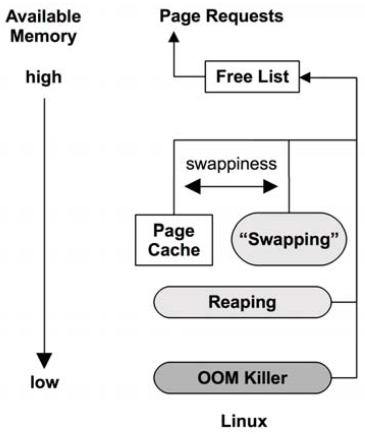
Figure 7-6 Freeing memory
-
Page cache: the file system cache. A tunable parameter called swappiness sets the degree to which to favor freeing memory from the page cache as opposed to swapping.
Higher values favor freeing memory by paging applications, and lower values by reclaiming it from the page cache.
-
Swapping: only available if a swap file or device has been configured.
-
OOM killer: The out-of-memory killer will free memory by finding and killing a sacrificial process, found using select_bad_process() and then killed by calling oom_kill_process().
What happens if no swap device or swap file, the OOM killer is used sooner.
Consider an application issue with endless memory growth. With swap, this is likely to first become a performance issue due to paging, which is an opportunity to debug the issue live. Without swap, there is no paging grace period, the OOM killer terminates it. This may delay debugging the issue if it is seen only after hours of usage.
Free List(s)
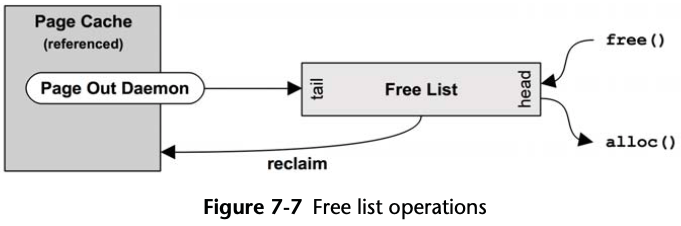
Memory freed is added to the head of the list, for future allocations. Memory that is freed by the page-out daemon—and that may still contain useful cached file system pages—is added to the tail.
Free lists are typically consumed via allocators, such as the slab allocator for the kernel, and libc malloc for user-space. These in turn consume pages and then expose them via their allocator API.
Linux uses the buddy allocator for managing pages. This provides multiple free lists for different-size memory allocations, following a power-of-two scheme.
The term buddy refers to finding neighboring pages of free memory so that they can be allocated together.
The buddy free lists are at the bottom of the following hierarchy, beginning with the per-memory node pg_data_t:
- Nodes: banks of memory, NUMA-aware
- Zones: ranges of memory for certain purposes (direct memory access (DMA), normal, highmem)
- Migration types: unmovable, reclaimable, movable, …
- Sizes: power-of-two number of pages
Allocating within the node free lists improves memory locality and performance.
Reaping
Reaping mostly involves freeing memory from the kernel slab allocator caches. These caches contain unused memory in slab-size chunks, ready for reuse. Reaping returns this memory to the system for page allocations.
Page Scanning
When available main memory in the free list drops below a threshold, the page-out daemon (kswapd) begins page scanning.
kswapd scans LRU page lists of inactive and active memory to free pages.
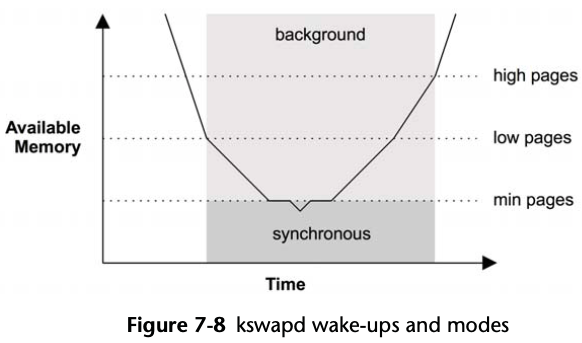
Once free memory has reached the lowest threshold, kswapd operates in synchronous mode, freeing pages of memory as they are requested (the kernel is exempt from this requirement). This lowest threshold is tunable (vm.min_free_kbytes), and the others are scaled based on it (by 2x, 3x).
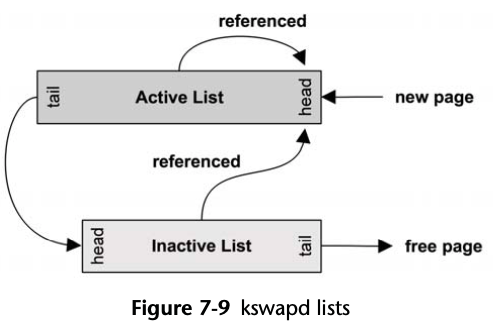
kswapd scans the inactive list first, and then the active if needed.
7.3.3 Process Address Space
Managed by both hardware and software, the process virtual address space is a range of virtual pages that are mapped to physical pages as needed. The addresses are split into areas called segments for storing the thread stacks, process executable, libraries, and heap.
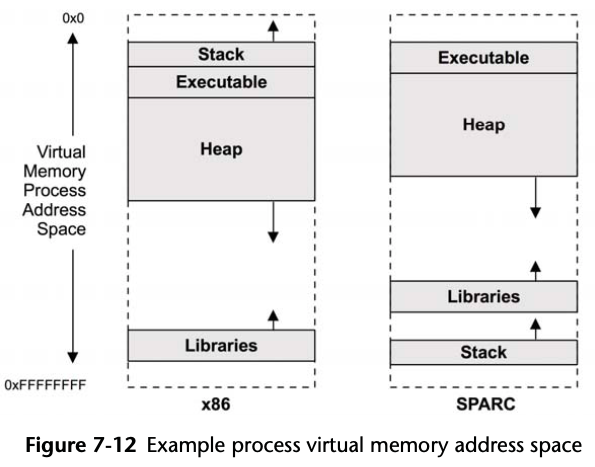
- Executable text: contains the executable CPU instructions for the process. This is mapped from the text segment of the binary program on the file system. It is read-only with the execute permission.
- Executable data: contains initialized variables mapped from the data segment of the binary program. This has read/write permissions, so that the variables can be modified while the program is running. It also has a private flag, so that modifications are not flushed to disk.
- Heap: This is the working memory for the program and is anonymous memory (no file system location). It grows as needed and is allocated via malloc().
- Stack: stacks of the running threads, mapped read/write.
Heap Growth
A common source of confusion is the endless growth of heap. Is it a memory leak?
For most allocators, a free does not return memory to the operating system; rather, it keeps it ready to serve future allocations. This means the process resident memory will only ever grow, which is normal. Methods for processes to reduce memory include
- Re-exec: calling exec()to begin from an empty address space
- Memory mapping: using mmap() and munmap(), which will return memory to the system
7.3.4 Allocators
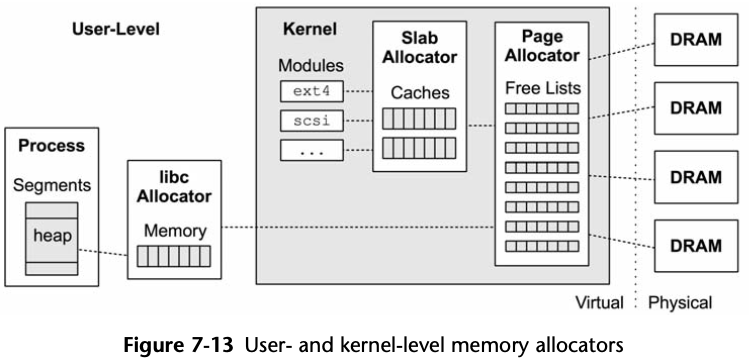
glibc
- Small allocations are served from bins of memory, containing units of a similar size, which can be coalesced using a buddy-like algorithm.
- Larger allocations can use a tree lookup to find space efficiently.
- Very large allocations switch to using mmap, and the memory chunks are returned to the system on free(3).
The following is from malloc man page:
Normally, malloc() allocates memory from the heap, and adjusts the size of the heap as required, using sbrk. When allocating blocks of memory larger than MMAP_THRESHOLD bytes, the glibc malloc() implementation allocates the memory as a private anonymous mapping using mmap). MMAP_THRESHOLD is 128 kB by default, but is adjustable using mallopt(3).
7.4 Methodology
Table 7-3 Memory Performance Methodologies
| Methodology | Types |
|---|---|
| Tools method | observational analysis |
| USE method | observational analysis |
| Characterizing usage | observational analysis, capacity planning |
| Cycle analysis | observational analysis |
| Performance monitoring | observational analysis, capacity planning |
| Leak detection | observational analysis |
| Static performance tuning | observational analysis, capacity planning |
| Resource controls | tuning |
| Micro-benchmarking | experimental analysis |
My suggestion is to use the following strategies to start with, in this order:
- performance monitoring
- the USE method
- characterizing usage.
7.4.1 Tools Method
- Page scanning: Look for continual page scanning (more than 10 s) as a sign of memory pressure. This can be done using sar -B and checking the pgscan columns.
- Paging: The paging of memory is a further indication that the system is low on memory. Use vmstat(8) and check the si and so columns (here, the term swapping means anonymous paging).
- vmstat: Run vmstat per second and check the free column for available memory.
- OOM killer: these events can be seen in dmesg.
- top/prstat: See which processes and users are the top physical memory consumers (resident) and virtual memory consumers.
- dtrace/stap/perf: Trace memory allocations with stack traces, to identify the cause of memory usage
7.4.2 USE Method
- Utilization: how much memory is in use, and how much is available. Both physical memory and virtual memory should be checked.
- Saturation: the degree of page scanning, paging, swapping, and Linux OOM killer sacrifices performed, as measures to relieve memory pressure.
- Errors: failed memory allocations.
Saturation may be checked first, as continual saturation is a sign of a memory issue. These metrics are usually readily available from operating system tools, including vmstat, sar, and dmesg, for OOM killer sacrifices.
7.4.3 Characterizing Usage
For memory, this involves identifying where and how much memory is used:
- System-wide physical and virtual memory utilization
- Degree of saturation: paging, swapping, OOM killing
- Kernel and file system cache memory usage
- Per-process physical and virtual memory usage
- Usage of memory resource controls, if present
Here is an example description to show how these attributes can be expressed together:
The system has 256 Gbytes of main memory, which is only at 1% utilization, with 30% in a file system cache. The largest process is a database, consuming 2 Gbytes of main memory (RSS), which is its configured limit from the previous system it was migrated from.
Advanced Usage Analysis/Checklist
- Where is the kernel memory used? Per slab?
- How much of the file system cache (or page cache) is active as opposed to inactive?
- Where is the process memory used?
- Why are processes allocating memory (call paths)?
- Why is the kernel allocating memory (call paths)?
- What processes are actively being paged/swapped out?
- What processes have previously been paged/swapped out?
- May processes or the kernel have memory leaks?
- In a NUMA system, how well is memory distributed across memory nodes?
- What are the CPI and memory stall cycle rates?
- How balanced are the memory busses?
- How much local memory I/O is performed as opposed to remote memory I/O?
7.4.4 Cycle Analysis
7.4.5 Performance Monitoring
Monitoring memory usage over time, especially by process, can help identify the presence and rate of memory leaks.
7.4.6 Leak Detection
7.4.7 Static Performance Tuning
- How much main memory is there in total?
- How much memory are applications configured to use (their own config)?
- Which memory allocators do the applications use?
- What is the speed of main memory? Is it the fastest type available?
- What is the system architecture? NUMA, UMA?
- Is the operating system NUMA-aware?
- How many memory busses are present?
- What are the number and size of the CPU caches? TLB?
- Are large pages configured and used?
- Is overcommit available and configured?
- What other system memory tunables are in use?
- Are there software-imposed memory limits (resource controls)?
7.4.8 Resource Controls
7.4.9 Micro-Benchmarking
Micro-benchmarking may be used to determine the speed of main memory and characteristics such as CPU cache and cache line sizes. It may be helpful when analyzing differences between systems, as the speed of memory access may have a greater effect on performance than CPU clock speed, depending on the application and workload.
7.5 Analysis
Table 7-4 Memory Analysis Tools
| Linux | Description |
|---|---|
| vmstat | virtual and physical memory statistics |
| sar | historical statistics |
| slabtop | kernel slab allocator statistics |
| ps | process status |
| top | monitor per-process memory usage |
| pmap | process address space statistics |
| DTrace | allocation tracing |
7.5.1 vmstat
vmstat 1 -w
procs -----------------------memory---------------------- ---swap-- -----io---- -system-- --------cpu--------
 r  b         swpd         free         buff        cache   si   so    bi    bo   in   cs  us  sy  id  wa  st
 1  0            0       529312        29940       884980    0    0     2     1    0    1   0   0  99   0   0
 1  0            0       577808        29940       884996    0    0     0     0  379  116   6   7  88   0   0
 1  0            0       577960        29940       884996    0    0     0     0  323   65   6   7  87   0   0
 1  0            0       577960        29940       884996    0    0     0     0  308   47   6   7  88   0   0
 1  0            0       577960        29940       884996    0    0
The columns are in kilobytes by default, show in megabytes with -S option, if
needed.
- swpd: amount of swapped-out memory
- free: free available memory (totally unused)
- buff: memory in the buffer cache
- cache: memory in the page cache
- si: memory swapped in (paging)
- so: memory swapped out (paging)
$ vmstat 1 -wSm
procs -----------------------memory---------------------- ---swap-- -----io---- -system-- --------cpu--------
 r  b         swpd         free         buff        cache   si   so    bi    bo   in   cs  us  sy  id  wa  st
 0  0            0          677           30          906    0    0     2     1    0    1   0   0  99   0   0
 0  0            0          677           30          906    0    0     0     0   63   71   0   0 100   0   0
There is also a -a option for printing a breakdown of inactive and active memory from the page cache:
$ vmstat 1 -aw
procs -----------------------memory---------------------- ---swap-- -----io---- -system-- --------cpu--------
 r  b         swpd         free        inact       active   si   so    bi    bo   in   cs  us  sy  id  wa  st
 0  0            0       661088       432928       452080    0    0     2     1    0    1   0   0  99   0   0
 0  0            0       661088       432928       452256    0    0     0     0   44   43   0   0 100   0   0
 0  0            0       661088       432928       452316    0    0     0    36   83   94   0   0 100   0   0
 0  0            0       661088       432928       452316    0    0     0     0   50   57   0   0 100   0   0
Another way to see active/inactive page cache is -s, in form of a list:
$ vmstat -s
      1772580 K total memory
       195304 K used memory
       452196 K active memory
       432932 K inactive memory
       661572 K free memory
        30116 K buffer memory
       885588 K swap cache
            0 K total swap
            0 K used swap
            0 K free swap
       935923 non-nice user cpu ticks
         1101 nice user cpu ticks
      1276991 system cpu ticks
    500000062 idle cpu ticks
        99470 IO-wait cpu ticks
        87697 IRQ cpu ticks
       202462 softirq cpu ticks
            0 stolen cpu ticks
      9464867 pages paged in
      6424004 pages paged out
            0 pages swapped in
            0 pages swapped out
     87919499 interrupts
     88801657 CPU context switches
   1598228500 boot time
       227020 forks
7.5.2 sar
The system activity reporter, sar, can be used to observe current activity and can be configured to archive and report historical statistics.
sar provides memory statistics via the following options:
- -B: paging statistics
- -H: huge pages statistics
- -r: memory utilization
- -R: memory statistics
- -S: swap space statistics
- -W: swapping statistics
Table 7-5 Linux sar Statistics
| Option | Statistic | Description | Units |
|---|---|---|---|
| -B | pgpgin/s | page-ins | Kbytes/s |
| -B | pgpgout/s | page-outs | Kbytes/s |
| -B | fault/s | both major and minor faults | count/s |
| -B | majflt/s | major faults | count/s |
| -B | pgfree/s | pages added to free list | count/s |
| -B | pgscank/s | pages scanned by background page-out daemon (kswapd) | count/s |
| -B | pgscand/s | direct page scans | count/s |
| -B | pgsteal/s | page and swap cache reclaims | count/s |
| -B | %vmeff | ratio of page steal/page scan, which shows page reclaim efficiency | percent |
| -H | hbhugfree | free huge pages memory (large page size) | Kbytes |
| -H | hbhugused | used huge pages memory | Kbytes |
| -r | kbmemfree | free memory | Kbytes |
| -r | kbmemused | used memory (excluding the kernel) | Kbytes |
| -r | kbbuffers | buffer cache size | Kbytes |
| -r | kbcached | page cache size | Kbytes |
| -r | kbcommit | main memory committed: an estimate of the amount needed to serve the current workload | Kbytes |
| -r | %commit | main memory committed for current workload, estimate | percent |
| -r | kbactive | active list memory size | Kbytes |
| -r | kbinact | inactive list memory size | Kbytes |
| -R | frpg/s | memory pages freed; negative indicates allocations | pages/s |
| -R | bufpg/s | buffer cache page additions (growth) | pages/s |
| -R | campg/s | page cache page additions (growth) | pages/s |
| -S | kbswpfree | free swap space | Kbytes |
| -S | kbswpused | used swap space | Kbytes |
| -S | kbswpcad | cached swap space: this resides in both main memory and the swap device and so can be paged out without disk I/O | Kbytes |
| -W | pswpin/s | page-ins (Linux “swap-ins”) | pages/s |
| -W | pswpout/s | page-outs (Linux “swap-outs”) | pages/s |
sar -B 1
Linux 5.7.8+ (arm-64) 	08/31/2020 	_aarch64_	(8 CPU)

07:22:45 AM  pgpgin/s pgpgout/s   fault/s  majflt/s  pgfree/s pgscank/s pgscand/s pgsteal/s    %vmeff
07:22:46 AM      0.00      0.00      3.00      0.00     14.00      0.00      0.00      0.00      0.00
07:22:47 AM      0.00      0.00      0.00      0.00      1.00      0.00      0.00      0.00      0.00
sar -r 1
Linux 5.7.8+ (arm-64) 	08/31/2020 	_aarch64_	(8 CPU)

07:25:02 AM kbmemfree   kbavail kbmemused  %memused kbbuffers  kbcached  kbcommit   %commit  kbactive   kbinact   kbdirty
07:25:03 AM    658164   1296572     99504      5.61     30416    799532    413780     23.34    455536    432756         0
07:25:04 AM    658164   1296572     99504      5.61     30416    799532    413780     23.34    455536    432756         0
07:25:05 AM    658164   1296572     99504      5.61     30416    799532    413780     23.34    455536    432756         0
sar -S 1
Linux 5.7.8+ (arm-64) 	08/31/2020 	_aarch64_	(8 CPU)

07:26:27 AM kbswpfree kbswpused  %swpused  kbswpcad   %swpcad
07:26:28 AM         0         0      0.00         0      0.00
07:26:29 AM         0         0      0.00         0      0.00

Average:            0         0      0.00         0      0.00
root@arm-64:~# sar -W 1
Linux 5.7.8+ (arm-64) 	08/31/2020 	_aarch64_	(8 CPU)

07:26:35 AM  pswpin/s pswpout/s
07:26:36 AM      0.00      0.00
07:26:37 AM      0.00      0.00
Average:         0.00      0.00
To understand these in deeper detail, you may need to browse the source code in mm, specifically mm/vmscan.c.
The %vmeff metric is an interesting measure of page reclaim efficiency. High means pages are successfully stolen from the inactive list (healthy); low means the system is struggling. The man page describes near 100% as high, and less than 30% as low.
7.5.3 slabtop
# slabtop
 Active / Total Objects (% used)    : 489927 / 516412 (94.9%)
 Active / Total Slabs (% used)      : 15901 / 15901 (100.0%)
 Active / Total Caches (% used)     : 95 / 155 (61.3%)
 Active / Total Size (% used)       : 162300.24K / 176501.14K (92.0%)
 Minimum / Average / Maximum Object : 0.02K / 0.34K / 16.25K

  OBJS ACTIVE  USE OBJ SIZE  SLABS OBJ/SLAB CACHE SIZE NAME
 17640  12123  68%    1.33K    735       24     23520K ext4_inode_cache
 26906  26244  97%    0.70K   1223       22     19568K inode_cache
 17640  16930  95%    0.87K    490       36     15680K shmem_inode_cache
 67710  61750  91%    0.21K   1830       37     14640K dentry
 16660  12641  75%    0.57K    595       28      9520K radix_tree_node
 70656  67302  95%    0.12K   2208       32      8832K buffer_head
  6240   6069  97%    1.00K    195       32      6240K kmalloc-1k
  2464   2392  97%    2.00K    154       16      4928K kmalloc-2k
  1232   1232 100%    4.00K    154        8      4928K kmalloc-4k
  1216   1174  96%    3.94K    152        8      4864K task_struct
 24906  24322  97%    0.19K   1186       21      4744K pid
 14825  14316  96%    0.31K    593       25      4744K filp
  4096   4096 100%    1.00K    128       32      4096K sock_inode_cache
 31712  30648  96%    0.12K    991       32      3964K kmalloc-128
  3120   2997  96%    1.19K    120       26      3840K signal_cache
  4520   4316  95%    0.77K    226       20      3616K proc_inode_cache
The slab statistics are from /proc/slabinfo and can also be printed using vmstat
-m.
# vmstat -m
Cache                       Num  Total   Size  Pages
scsi_sense_cache            256    256    128     32
ext4_groupinfo_4k          4368   4368    168     24
btrfs_extent_buffer           0      0    336     24
btrfs_free_space_bitmap       0      0  12288      2
btrfs_trans_handle            0      0    104     39
btrfs_inode                   0      0   1488     22
mqueue_inode_cache           30     30   1088     30
f2fs_extent_tree              0      0     96     42
f2fs_discard_cmd              0      0    152     26
f2fs_discard_entry            0      0     88     46
f2fs_free_nid                 0      0     24    170
f2fs_inode_cache              0      0   1424     23
gfs2_qadata                   0      0    264     31
gfs2_rgrpd                  200    200    160     25
gfs2_inode                    0      0   1128     29
gfs2_glock(aspace)            0      0    648     25
gfs2_glock                    0      0    416     39
o2dlm_lockres                21     21    384     21
o2dlm_mle                     0      0    448     36
dlmfs_inode_cache             0      0   1024     32
ocfs2_dquot_cache             0      0    320     25
[...]
7.5.5 ps (process status)
- %MEM: main memory usage (physical memory, RSS) as a percentage of the total in the system
- RSS: resident set size (Kbytes)
- VSZ: virtual memory size (Kbytes)
ps can also print columns for major and minor faults (maj_flt, min_flt) with -o
option.
7.5.6 top
Tasks: 154 total,   1 running, 108 sleeping,   0 stopped,   1 zombie
Tasks: 154 total,   1 running, 108 sleeping,   0 stopped,   1 zombie
Mem:    936508k total,   651244k used,   285264k free,    11824k buffers
Swap:        0k total,        0k used,        0k free,   370384k cached
400%cpu  14%user   0%nice  17%sys 369%idle   0%iow   0%irq   0%sirq   0%host
  PID USER         PR  NI VIRT  RES  SHR S[%CPU] %MEM     TIME+ ARGS
 3977 root         20   0 5.7M 2.9M 2.5M R 28.5   0.3   0:00.13 top
- RES: resident set size
7.5.8 pmap
pmap -x 812
812:   /sbin/wpa_supplicant -u -s -O /run/wpa_supplicant
Address           Kbytes     RSS   Dirty Mode  Mapping
0000aaaaba419000    2624     240       0 r-x-- wpa_supplicant
0000aaaaba6b8000      56      56      56 r---- wpa_supplicant
0000aaaaba6c6000       4       4       4 rw--- wpa_supplicant
0000aaaaba6c7000       4       4       4 rw---   [ anon ]
0000aaaacbb6d000     132      48      48 rw---   [ anon ]
0000ffffbd036000       8       4       4 rw---   [ anon ]
0000ffffbd038000     136       0       0 r-x-- libgpg-error.so.0.29.0
0000ffffbd05a000      60       0       0 ----- libgpg-error.so.0.29.0
0000ffffbd069000       4       4       4 r---- libgpg-error.so.0.29.0
0000ffffbd06a000       4       4       4 rw--- libgpg-error.so.0.29.0
0000ffffbd06b000       8       8       8 rw---   [ anon ]
0000ffffbd06d000     728       0       0 r-x-- libgcrypt.so.20.2.5
0000ffffbd123000      60       0       0 ----- libgcrypt.so.20.2.5
[...]
0000ffffefd6a000     132       8       8 rw---   [ stack ]
---------------- ------- ------- -------
total kB           12512    2452     636
- Kbytes: virtual memory
- RSS: main memory
The output of pmap(1) can be long for processes with many mappings. It also pauses the process as it reports memory usage, which can hurt the performance of active work. It is useful to run when needed for diagnosis and analysis, but it shouldn’t be run regularly as a monitoring tool.
7.5.9 DTrace
7.5.10 SystemTap
7.5.11 Other Tools
- free: report free memory, with buffer cache and page cache.
- dmesg: check for “Out of memory” messages from the OOM killer.
- valgrind: a performance analysis suite, including memcheck, a wrapper for user-level allocators for memory usage analysis including leak detection. This costs significant overhead; the manual advises that it can cause the target to run 20 to 30 times slower.
- swapon: to add and observe physical swap devices or files.
- iostat: If the swap device is a physical disk or slice, device I/O may be observable using iostat, which indicates that the system is paging.
- perf: can be used to investigate CPI, MMU/TSB events, and memory bus stall cycles from the CPU performance instrumentation counters. It also provides probes for page faults and several kernel memory (kmem) events.
- /proc/zoneinfo: statistics for memory zones (NUMA nodes).
- /proc/buddyinfo: statistics for the kernel buddy allocator for pages.
7.6 Tuning
7.6.1 Tunable Parameters
Table 7-7 Example Linux Memory Tunables
| Option | Default | Description |
|---|---|---|
| vm.dirty_background_bytes | 0 | amount of dirty memory to trigger pdflush background write-back |
| vm.dirty_background_ratio | 10 | percentage of dirty system memory to trigger pdflush background write-back |
| vm.dirty_bytes | 0 | amount of dirty memory that causes a writing process to start write-back |
| vm.dirty_ratio | 20 | ratio of dirty system memory to cause a writing process to begin write-back |
| vm.dirty_expire_centisecs | 3,000 | minimum time for dirty memory to be eligible for pdflush (promotes write cancellation) |
| vm.dirty_writeback_centisecs | 500 | pdflush wake-up interval (0 to disable) |
| vm.min_free_kbytes | dynamic | sets the desired free memory amount (some kernel atomic allocations can consume this) |
| vm.overcommit_memory | 0 | 0 = use a heuristic to allow reasonable overcommits; 1 = always overcommit; 2 = don’t overcommit |
| vm.swappiness | 100 | the degree to favor swapping (paging) for freeing memory over reclaiming it from the page cache |
| vm.vfs_cache_pressure | 100 | the degree to reclaim cached directory and inode objects; lower values retain them more; 0 means never reclaim—can easily lead to out-of-memory conditions |
Note that dirty_background_bytes and dirty_background_ratio are mutually exclusive, as are dirty_bytes and dirty_ratio.
vm.min_free_kbytes can be reduced to free up some memory for applications, but that can also cause the kernel to be overwhelmed during memory pressure and resort to using OOM sooner.
Another parameter for avoiding OOM is vm.overcommit_memory, which can be set to 2 to disable overcommit and avoid cases where this leads to OOM.
The vm.swappiness tunable can significantly affect performance should it begin swapping application memory earlier than desired. The value of this tunable can be between 0 and 100, with high values favoring swapping applications and therefore retaining the page cache. It may be desirable to set this to zero, so that application memory is retained as long as possible at the expense of the page cache. When there is still a memory shortage, the kernel can still use swapping.
7.6.2 Multiple Page Sizes
Large page sizes can improve memory I/O performance by improving the hit ratio of the TLB cache (increasing its reach).
Documentation/vm/hugetlbpage.txt
Linux support transparent huge pages (THP). This uses huge pages when appropriate, without manual steps from the system administrator. For reference, see Documentation/vm/transhuge.txt.
7.6.4 Resource Controls
The container groups (cgroups) memory subsystem provides various additional controls. These include
- memory.memsw.limit_in_bytes: the maximum allowed memory and swap space
- memory.limit_in_bytes: the maximum allowed user memory, including file cache usage
- memory.swappiness: similar to vm.swappiness described earlier but can be set for a cgroup
- memory.oom_control: can be set to 0, to allow the OOM killer for this cgroup, or 1, to disable it
7.7 Exercises
- Answer the following questions about memory terminology:
- What is a page of memory?
- What is resident memory?
- What is virtual memory?
- Using Linux terminology, what is the difference between paging and swapping?
- Answer the following conceptual questions:
- What is the purpose of demand paging?
- Describe memory utilization and saturation.
- What is the purpose of the MMU and the TLB?
- What is the role of the page-out daemon?
- What is the role of the OOM killer?
- Answer the following deeper questions:
- What is anonymous paging, and why is it more important to analyze than file system paging?
- Describe the steps the kernel takes to free up more memory when free memory becomes exhausted on Linux systems.
- Describe the performance advantages of slab-based allocation.
- Develop the following procedures for your operating system:
- A USE method checklist for memory resources. Include how to fetch each metric (e.g., which command to execute) and how to interpret the result. Try to use existing OS observability tools before installing or using additional software products.
- A workload characterization checklist for memory resources. Include how to fetch each metric, and try to use existing OS observability tools first.
- Perform these tasks:
- Choose an application, and summarize code paths that lead to memory allocation (malloc()).
- Choose an application that has some degree of memory growth (calling brk()), and summarize code paths that lead to this growth.
- Describe the memory activity visible in the following Linux screen shot alone:
# vmstat 1
procs -----------------------memory---------------------- ---swap-- -----io---- --system-- --------cpu--------
 r  b         swpd         free         buff        cache   si   so    bi    bo    in    cs  us  sy  id  wa  st
 2  0       413344        62284           72         6972    0    0    17    12     1     1   0   0 100   0   0
 2  0       418036        68172           68         3808    0 4692  4520   4692 1060  1939  61  38   0   1   0
 2  0       418232        71272           68         1696    0  196 23924    196 1288  2464  51  38   0  11   0
 2  0       418308        68792           76         2456    0   76  3408     96 1028  1873  58  39   0   3   0
 1  0       418308        67296           76         3936    0    0  1060      0 1020  1843  53  47   0   0   0
 1  0       418308        64948           76         3936    0    0     0      0 1005  1808  36  64   0   0   0
 1  0       418308        62724           76         6120    0    0  2208      0 1030  1870  62  38   0   0   0
 1  0       422320        62772           76         6112    0 4012     0   4016 1052  1900  49  51   0   0   0
 1  0       422320        62772           76         6144    0    0     0      0 1007  1826  62  38   0   0   0
 1  0       422320        60796           76         6144    0    0     0      0 1008  1817  53  47   0   0   0
 1  0       422320        60788           76         6144    0    0     0      0 1006  1812  49  51   0   0   0
 3  0       430792        65584           64         5216    0 8472  4912   8472 1030  1846  54  40   0   6   0
 1  0       430792        64220           72         6496    0    0  1124     16 1024  1857  62  38   0   0   0
 2  0       434252        68188           64         3704    0 3460  5112   3460 1070  1964  60  40   0   0   0
 2  0       434252        71540           64         1436    0    0 21856      0 1300  2478  55  41   0   4   0
 1  0       434252        66072           64         3912    0    0  2020      0 1022  1817  60  40   0   0   0
[...]
- (optional, advanced) Find or develop metrics to show how well the kernel NUMA memory locality policies are working in practice. Develop “known” workloads that have good or poor memory locality for testing the metrics.
- (optional, advanced) Develop a tool that measures or estimates the working set size of a process. This should be safe to use in production systems (a requirement that may make this impossible). A partial solution is to do this for file system pages only (not the heap).
Chapter 8 File Systems
8.1 Terminology
I/O does not include open() and close().
Logical I/O: I/O issued by the application to the file system.
Physical I/O: I/O issued directly to disks by the file system (or via raw I/O).
8.2 Models
8.2.1 File System Interfaces
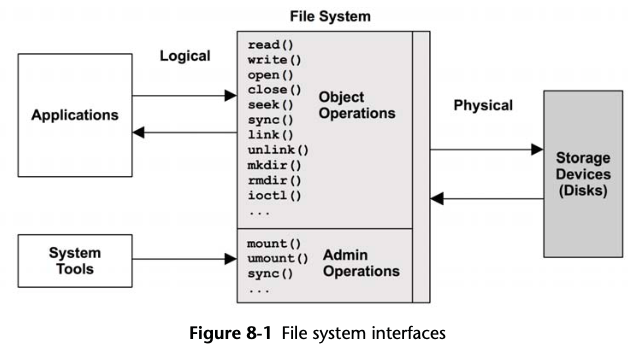
One approach for studying file system performance is to treat it as a black box, focusing on the latency of the object operations. This is explained in more detail in Section 8.5.2, Latency Analysis.
8.2.2 File System Cache
The file system cache may also buffer writes to be written (flushed) later. The mechanisms for doing this differ for different file system types and are described in Section 8.4, Architecture.
8.3 Concepts
8.3.1 File System Latency
File system latency is the primary metric of file system performance, measured as the time from a logical file system request to its completion. It is inclusive of time spent in:
- the file system
- kernel disk I/O subsystem
- and waiting on disk devices — the physical I/O.
Application threads often block during an application request to wait for file system requests to complete, for which file system latency directly and proportionally affects application performance.
Application may not be directly affected if using non-blocking I/O, or the I/O is issued from an asynchronous thread (e.g., a background flush thread).
A generic approach is to use a kernel tracing tool that can show the user-level stack trace that led to a logical file system I/O. This stack trace can then be studied to see which application routines issued it.
8.3.2 Caching
File systems use caching to improve read performance, and buffering (in the cache) to improve write performance.
Commonly used cache types are:
| Cache | Example |
|---|---|
| Page cache | OS page cache |
| Directory cache | dentry cache |
| inode cache | inode cache |
| Block device cache | buffer cache |
8.3.4 Prefetch
Prefetch is a common file system feature that can detect sequential read workload based on the current and previous file I/O offsets, and then predict and issue disk reads before the application has requested them.
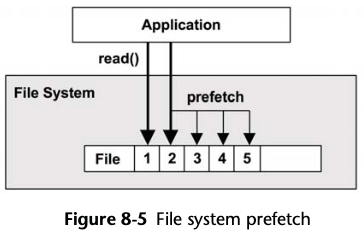
8.3.6 Write-Back Caching
It works by treating writes as completed after the transfer to main memory, and writing them to disk sometime later, asynchronously. The file system process for writing this “dirty” data to disk is called flushing.
8.3.7 Synchronous Writes
A synchronous write completes only when fully written to persistent storage, which includes writing any file system metadata changes that are necessary.
There are two forms of synchronous writes:
- Individual I/O which is written synchronously
- and groups of previous writes which are synchronously committed.
Individual Synchronous Writes
Write I/O is synchronous when a file is opened using the flag O_SYNC.
Some file systems have mount options (dirsync, sync) to force all write I/O to all files to be synchronous.
Related mount options excerpted from mount man page:
dirsync
All directory updates within the filesystem should be done synchronously.
This affects the following syscalls: creat, link, unlink, symlink, mkdir, rmdir, mknod and rename.
sync
All I/O to the filesystem should be done synchronously.
Synchronously Committing Previous Writes
Rather than synchronously writing individual I/O, an application may synchronously commit previous asynchronous writes at checkpoints in their code, using the fsync() system call. This can improve performance by grouping the synchronous writes.
There are other situations that will commit previous writes, such as closing file handles, or when there are too many uncommitted buffers on a file.
8.3.8 Raw and Direct I/O
Raw I/O is issued directly to disk offsets, bypassing the file system altogether.
Direct I/O allows applications to use a file system but bypass the file system
cache.
Depending on the file system, this may not only disable read caching and write buffering but may also disable prefetch.
8.3.10 Memory-Mapped Files
For some applications and workloads, file system I/O performance can be improved by mapping files to the process address space and accessing memory offsets directly. This avoids the syscall execution and context switch overheads incurred when calling read() and write() syscalls to access file data. It can also avoid double copying of data, if the kernel supports direct copying of the file data buffer to the process address space.
Mappings can be tuned using madvise().
If the issue is high I/O latency from disk devices, avoiding the small syscall overheads with mmap() may accomplish very little.
A disadvantage of using mappings on multiprocessor systems can be the overhead to keep each CPU MMU in sync, specifically the CPU cross calls to remove mappings (TLB shootdowns). Depending on the kernel and mapping, these may be minimized by delaying TLB updates (lazy shootdowns).
8.3.11 Metadata
Logical Metadata
Logical metadata is information that is read and written to the file system by consumers (applications), either
- Explicitly: reading file statistics (stat()), creating and deleting files (creat(), unlink()) and directories (mkdir(), rmdir())
- Implicitly: file system access timestamp updates, directory modification timestamp updates
Physical Metadata
Physical metadata refers to the on-disk layout metadata necessary to record all file system information. The metadata types in use depend on the file system type and may include superblocks, inodes, blocks of data pointers (primary, secondary, …), and free lists.
8.3.12 Logical versus Physical I/O
I/O requested by applications to the file system (logical I/O) may not match disk I/O (physical I/O)
An example is application performed only a single 1-byte write, the disks may need to perform multiple reads (128 Kbytes in total) and more writes (over 128 Kbytes).
8.3.13 Operations Are Not Equal
Some operations may return from the file system cache at memory speeds; others may return from disk and be orders of magnitude slower. Other determinant factors include whether operations are random or sequential, reads or writes, synchronous writes or asynchronous writes, their I/O size, whether they include other operation types, and their CPU execution cost.
Table 8-2 Example File System (ext4) Operation Latencies
| Operation | Average (μs) |
|---|---|
| open() | 2.2 |
| close() | 0.7 |
| read() 4 Kbytes (cached) | 3.3 |
| read() 128 Kbytes (cached) | 13.9 |
| write() 4 Kbytes (async) | 9.3 |
| write() 128 Kbytes (async) | 55.2 |
8.3.15 Access Timestamps
Access timestamps, which record the time that each file and directory was accessed (read). This causes file metadata to be updated whenever files are read, creating a write workload that consumes disk I/O resources.
Access timestamp writes can be deferred and grouped to reduce interference with the active workload.
8.4 Architecture
8.4.1 File System I/O Stack
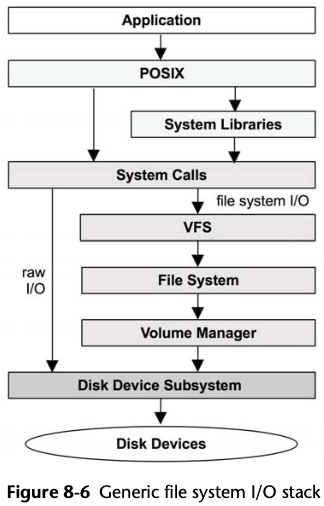
8.4.2 VFS
The VFS interface can serve as a common location for measuring the performance of any file system. Doing this may be possible using operating-system-supplied statistics or static or dynamic tracing.
8.4.3 File System Caches
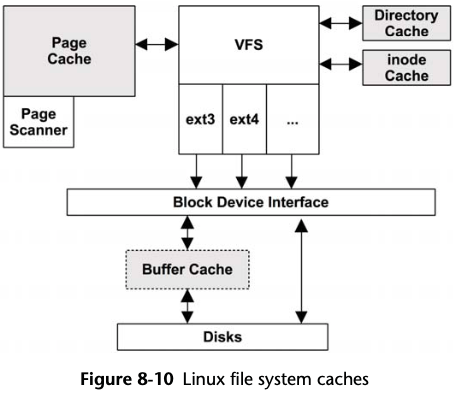
Buffer Cache
Since Linux 2.4, the buffer cache has been stored in the page cache following the SunOS unified buffer approach, avoiding the double caching and synchronization overhead.
The buffer cache is used for improving the performance of block device I/O.
The size of the buffer cache is dynamic and is observable from /proc/meminfo.
Page Cache
Prior to Linux 2.6.32, there was a pool of page dirty flush (pdflush) threads, between two and eight as needed. These have since been replaced by the flusher threads (named flush), which are created per device to better balance the per-device workload and improve throughput. Pages are flushed to disk for the following reasons:
- After an interval (30 s)
- The sync(), fsync(), or msync() system calls
- Too many dirty pages (dirty_ratio)
- No available pages in the page cache
The page-out daemon (kswapd), may also find and schedule dirty pages to be written to disk so that it can free the memory pages.
Dentry Cache
The dentry cache (Dcache) remembers mappings from directory entry (struct dentry) to VFS inode.
The Dcache entries are stored in a hash table for fast and scalable lookup (hashed by the parent dentry and directory entry name).
Performance has been further improved with the read-copy-update-walk (RCU-walk) algorithm. This attempts to walk the path name without updating dentry reference counts, which were causing scalability issues due to cache coherency with high rates on multi-CPU systems. If a dentry is encountered that isn’t in the cache, RCU-walk reverts to the slower reference-count walk (ref-walk), since reference counts will be necessary during file system lookup and blocking. For busy workloads, it’s expected that the dentrys will likely be cached, and so the RCU-walk approach will succeed.
The Dcache also performs negative caching, which remembers lookups for non-existent entries. This improves the performance of failed lookups, which commonly occur for library path lookup.
# slabtop -o | grep dentry
 84212  75327  89%    0.21K   2276       37     18208K dentry
Inode Cache
The VFS inodes are stored on a hash table for fast and scalable lookup (hashed by inode number and file system superblock), although most of the lookups will be done via the dentry cache.
The inode cache grows dynamically, holding at least all inodes mapped by the Dcache.
# slabtop -o | grep inode
 27808  27290  98%    0.70K   1264       22     20224K inode_cache
 25296  21376  84%    1.33K   1054       24     33728K ext4_inode_cache
 17856  17113  95%    0.87K    496       36     15872K shmem_inode_cache
  5420   5171  95%    0.77K    271       20      4336K proc_inode_cache
  4288   4288 100%    1.00K    134       32      4288K sock_inode_cache
  1470   1470 100%    0.09K     35       42       140K inotify_inode_mark
   252    202  80%    0.88K      7       36       224K fat_inode_cache
   117    117 100%    0.80K      3       39        96K ovl_inode
    42     42 100%    0.74K      2       21        32K hugetlbfs_inode_cache
    34     34 100%    0.92K      1       34        32K ext2_inode_cache
    30     30 100%    1.06K      1       30        32K mqueue_inode_cache
[...]
8.4.4 File System Features
Block versus Extent
Journaling
Copy-on-Write
8.4.5 File System Types
ext3
- Journaling: ordered mode, for metadata only, or journal mode, for metadata and data.
- Journal device: An external journal device can be used, so that the journal workload doesn’t contend with the read workload.
- Orlov block allocator: This spreads top-level directories across cylinder groups, so that the subdirectories and contents are more likely to be colocated, reducing random I/O.
- Directory indexes: These add hashed B-trees to the file system for faster directory lookups.
ext4
The Linux ext4 file system extending ext3 with various features and performance improvements: extents, large capacity, preallocation with fallocate(), delayed allocation, journal checksumming, faster fsck, multiblock allocator, nanosecond timestamps, and snapshots.
Key performance features, including those added since its release, are
- Extents: Extents improve contiguous placement, reducing random I/O and increasing the I/O size for sequential I/O.
- Preallocation: Via the fallocate() syscall, this allows applications to preallocate space that is likely contiguous, improving later write performance.
- Delayed allocation: Block allocation is delayed until it is flushed to disk, allowing writes to group (via the multiblock allocator), reducing fragmentation.
- Faster fsck: Unallocated blocks and inode entries are marked, reducing fsck time.
8.5 Methodology
Table 8-3 File System Performance Methodologies
| Methodology | Types |
|---|---|
| Disk analysis | observational analysis |
| Latency analysis | observational analysis |
| Workload characterization | observational analysis, capacity planning |
| Performance monitoring | observational analysis, capacity planning |
| Event tracing | observational analysis |
| Static performance tuning | observational analysis, capacity planning |
| Cache tuning | observational analysis, tuning |
| Workload separation | tuning |
| In-memory file systems | tuning |
| Micro-benchmarking | experimental analysis |
Use the following strategies to start with, in this order:
- latency analysis,
- performance monitoring
- workload characterization
- micro-benchmarking
- static analysis
- and event tracing.
8.5.1 Disk Analysis
With simpler file systems and smaller caches, this generally worked. Nowadays, this approach becomes confusing and misses entire classes of issues.
8.5.2 Latency Analysis
These four layers may be measured for latency analysis:
- Application
- Syscall interface
- VFS (e.g., vfs_write())
- Top of file system
Latency may be presented as
- Per-interval averages: for example, average read latency per second
- Full distributions: as histograms or heat maps
- Per-operation latency: listing every operation
Care must be taken for outliers.
Transaction Cost
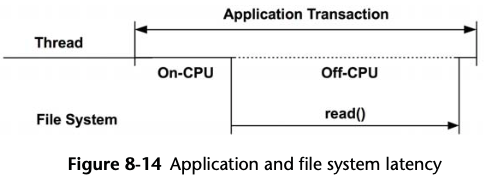
8.5.3 Workload Characterization
Characterizing the load applied is an important exercise when capacity planning, benchmarking, and simulating workloads. It can also lead to some of the largest performance gains by identifying unnecessary work that can be eliminated.
Here are the basic attributes for characterizing the file system workload:
- Operation rate and operation types
- File I/O throughput
- File I/O size
- Read/write ratio
- Synchronous write ratio
- Random versus sequential file offset access
Advanced Workload Characterization/Checklist
- What is the file system cache hit ratio? Miss rate?
- What are the file system cache capacity and current usage?
- What other caches are present (directory, inode, buffer) and what are their statistics?
- Which applications or users are using the file system?
- What files and directories are being accessed? Created and deleted?
- Have any errors been encountered? Was this due to invalid requests, or issues from the file system?
- Why is file system I/O issued (user-level call path)?
- To what degree is the file system I/O application synchronous?
- What is the distribution of I/O arrival times?
Performance Characterization
- What is the average file system operation latency?
- Are there any high-latency outliers?
- What is the full distribution of operation latency?
- Are system resource controls for file system or disk I/O present and active?
8.5.4 Performance Monitoring
Performance monitoring can identify active issues and patterns of behavior over time. Key metrics for file system performance are
- Operation rate
- Operation latency
The operation latency metric may be monitored as a per-second average and can include other values such as the maximum and standard deviation.
8.5.5 Event Tracing
Event tracing captures details for every file system operation. For observational analysis, this is the last resort. It adds performance overhead due to the capturing and saving of these details.
File system operation rates can reach the millions per second.
8.5.6 Static Performance Tuning
- How many file systems are mounted and actively used?
- What is the file system record size?
- Are access timestamps enabled?
- What other file system options are enabled (compression, encryption, …)?
- How has the file system cache been configured? Maximum size?
- How have other caches (directory, inode, buffer) been configured?
- Is a second-level cache present and in use?
- How many storage devices are present and in use?
- What is the storage device configuration? RAID?
- Which file system types are used?
- What is the version of the file system (or kernel)?
- Are there file system bugs/patches that should be considered?
- Are there resource controls in use for file system I/O?
8.5.7 Cache Tuning
The kernel and file system may use many different caches, including a buffer cache, directory cache, inode cache, and file system (page) cache.
In summary, check which caches exist, check that they are working, check how well they are working, check their sizes, then tune the workload for the cache and tune the cache for the workload.
8.5.10 Micro-Benchmarking
Typical factors that may be tested include
- Operation types: the rate of reads, writes, and other file system operations
- I/O size: 1 byte up to 1 Mbyte and larger
- File offset pattern: random or sequential
- Random-access pattern: uniform random or Pareto distribution
- Write type: asynchronous or synchronous (O_SYNC)
- Working set size: how well it fits in the file system cache
- Concurrency: number of I/O in flight, or number of threads performing I/O
- Memory mapping: file access via mmap(), instead of read()/write()
- Cache state: whether the file system cache is “cold” (unpopulated) or “warm”
- File system tunables: may include compression, data deduplication, and so on
Working set size: the volume of data that is accessed during the benchmark.
8.6 Analysis
Table 8-6 File System Analysis Tools
| Tools | Description |
|---|---|
| strace | system call debugger |
| dtrace | dynamic tracing of file system operations, latency |
| systemtap | ditto |
| ebpf | ditto |
| free | cache capacity statistics |
| top | includes memory usage summary |
| vmstat | virtual memory statistics |
| sar | various statistics, including historic |
| slabtop | kernel slab allocator statistics |
| meminfo | kernel memory breakdowns |
8.6.3 strace
This kind of debuggers can hurt performance and may be suitable for use only when the performance overhead is acceptable and other methods to analyze latency are not possible.
strace -ttT -p $PID
8.6.4 DTrace
8.6.5 SystemTap
8.6.6 LatencyTOP
Android
Latencies for process 177:
   Maximum     Average    Count  Reason
   1.46 ms     0.11 ms      728  __switch_to
8.6.7 free
Show buffer cache size and page cache size
8.6.8 top
Tasks: 155 total,   1 running, 108 sleeping,   0 stopped,   1 zombie
Mem:    936508k total,   652020k used,   284488k free,    24124k buffers
Swap:        0k total,        0k used,        0k free,   374156k cached
The output of android top includes buffers and cached page size.
8.6.9 vmstat
# vmstat 1
procs -----------memory---------- ---swap-- -----io---- -system-- ----cpu----
 r  b   swpd   free   buff  cache   si   so    bi    bo   in   cs us sy id wa
 0  0      0 284252  24128 374156    0    0     1     1    0   10  0  0 99  0
 0  0      0 284220  24128 374156    0    0     0     0    0   50  0  0 100 0
8.6.10 sar
sar -v 1
Linux 5.7.8+ (arm-64) 	08/27/2020 	_aarch64_	(8 CPU)

08:30:15 AM dentunusd   file-nr  inode-nr    pty-nr
08:30:16 AM     15672      1120     44109         5
08:30:17 AM     15655      1152     44083         5
-v option report status of inode, file and other kernel tables. The following
values are displayed:
- dentunusd: Number of unused cache entries in the directory cache.
- file-nr: Number of file handles used by the system.
- inode-nr: Number of inode handlers used by the system.
sar -r 1
Linux 5.7.8+ (arm-64) 	08/27/2020 	_aarch64_	(8 CPU)

08:32:56 AM kbmemfree   kbavail kbmemused  %memused kbbuffers  kbcached  kbcommit   %commit  kbactive   kbinact   kbdirty
08:32:57 AM    798252   1274952    104348      5.89     98800    539708    416392     23.49    470132    230220        28
08:32:58 AM    798252   1274952    104348      5.89     98800    539708    416392     23.49    470132    230220        28
08:32:59 AM    798252   1274952    104348      5.89     98800    539708    416392     23.49    470220    230220        28
08:33:00 AM    798400   1275100    104200      5.88     98800    539708    416392     23.49    470220    230220        28
8.6.11 slabtop
slabtop uses /proc/slabinfo, which exists if CONFIG_SLAB is enabled.
# slabtop -o
 Active / Total Objects (% used)    : 493097 / 529926 (93.1%)
 Active / Total Slabs (% used)      : 16864 / 16864 (100.0%)
 Active / Total Caches (% used)     : 93 / 155 (60.0%)
 Active / Total Size (% used)       : 195941.41K / 222825.39K (87.9%)
 Minimum / Average / Maximum Object : 0.02K / 0.42K / 16.25K

  OBJS ACTIVE  USE OBJ SIZE  SLABS OBJ/SLAB CACHE SIZE NAME
 74740  67012  89%    0.21K   2020       37     16160K dentry
 52320  36992  70%    1.33K   2180       24     69760K ext4_inode_cache
 48640  46656  95%    0.12K   1520       32      6080K buffer_head
 39808  39808 100%    0.06K    622       64      2488K anon_vma_chain
 31712  31530  99%    0.12K    991       32      3964K kmalloc-128
 27412  26563  96%    0.70K   1246       22     19936K inode_cache
 25641  25557  99%    0.19K   1221       21      4884K pid
 25536  25191  98%    0.12K    798       32      3192K kernfs_node_cache
 19548  19410  99%    0.11K    543       36      2172K anon_vma
 17856  17181  96%    0.87K    496       36     15872K shmem_inode_cache
 15325  15225  99%    0.31K    613       25      4904K filp
 11984   9260  77%    0.57K    428       28      6848K radix_tree_node
  8568   8568 100%    0.04K     84      102       336K pde_opener
  8160   6963  85%    0.04K     80      102       320K ext4_extent_status
  7640   7329  95%    0.77K    382       20      6112K proc_inode_cache
  6560   6234  95%    1.00K    205       32      6560K kmalloc-1k
  6336   6336 100%    0.25K    198       32      1584K kmalloc-256
  6272   2634  41%    0.06K     98       64       392K vmap_area
  6205   6205 100%    0.05K     73       85       292K ftrace_event_field
  6144   5931  96%    0.50K    192       32      3072K kmalloc-512
  5952   5920  99%    0.25K    186       32      1488K skbuff_head_cache
  4641   4641 100%    0.10K    119       39       476K task_delay_info
  4368   4368 100%    0.16K    182       24       728K ext4_groupinfo_4k
  4256   4256 100%    1.00K    133       32      4256K sock_inode_cache
  4004   4004 100%    0.14K    143       28       572K seq_file
  3968   3968 100%    0.12K    124       32       496K fs_cache
  3570   3570 100%    0.02K     21      170        84K page->ptl
  3304   3304 100%    0.07K     59       56       236K eventpoll_pwq
  3250   3250 100%    1.19K    125       26      4000K signal_cache
  3200   2641  82%    0.12K    100       32       400K kmalloc-rcl-128
  3136   3136 100%    1.00K     98       32      3136K mm_struct
  2900   2900 100%    1.25K    116       25      3712K UNIX
  2898   2898 100%    0.09K     63       46       252K trace_event_file
  2754   2754 100%    0.04K     27      102       108K lsm_file_cache
  2528   2435  96%    2.00K    158       16      5056K kmalloc-2k
  2139   2139 100%    0.69K     93       23      1488K files_cache
  1792   1792 100%    0.50K     56       32       896K kmem_cache
  1792   1792 100%    0.12K     56       32       224K kmem_cache_node
  1740   1676  96%    2.12K    116       15      3712K sighand_cache
  1536   1536 100%    0.02K      6      256        24K jbd2_revoke_table_s
  1504   1504 100%    0.25K     47       32       376K pool_workqueue
  1288   1260  97%    4.00K    161        8      5152K kmalloc-4k
  1280   1280 100%    3.94K    160        8      5120K task_struct
  1225   1225 100%    0.31K     49       25       392K mnt_cache
  1024   1024 100%    0.03K      8      128        32K ext4_pending_reservation
  1024   1024 100%    0.03K      8      128        32K ext4_io_end_vec
   966    966 100%    0.09K     23       42        92K inotify_inode_mark
   918    918 100%    0.04K      9      102        36K fat_cache
   704    704 100%    0.25K     22       32       176K proc_dir_entry
   700    700 100%    0.14K     25       28       100K jbd2_journal_head
   657    657 100%    0.05K      9       73        36K fsnotify_mark_connector
   584    584 100%    0.05K      8       73        32K mbcache
   512    512 100%    1.00K     16       32       512K bdev_cache
   512    512 100%    0.06K      8       64        32K ext4_io_end
   504    342  67%    0.88K     14       36       448K fat_inode_cache
8.6.14 meminfo
# cat /proc/meminfo
MemTotal:         936508 kB
MemFree:          284456 kB
MemAvailable:     665332 kB
Buffers:           24244 kB
Cached:           374156 kB
8.6.17 Other Tools
- df
- mount
- inotify
- fatrace
8.6.18 Visualizations
- heatmap
- flamegraph
- munin
8.7 Experimentation
8.7.2 Micro-Benchmark Tools
There are many file system benchmark tools available, including Bonnie, Bonnie++, iozone, tiobench, SysBench, fio, and FileBench.
fio
- Nonuniform random distributions, which can more accurately simulate a real-world access pattern (e.g., -random_distribution=pareto:0.9)
- Reporting of latency percentiles, including 99.00, 99.50, 99.90, 99.95, 99.99
fio --runtime=60 --time_based --clocksource=clock_gettime --name=randread -- numjobs=1 --rw=randread --random_distribution=pareto:0.9 --bs=8k --size=5g -- filename=fio.tmp
FileBench
FileBench is a programmable file system benchmark tool, where application workloads can be simulated by describing them in its Workload Model Language. This allows threads with different behaviors to be simulated, and for synchronous thread behavior to be specified. It ships with a variety of these configurations, called personalities.
Unfortunately, FileBench is not an easy tool to learn and use and may be of interest only to those working on file systems full-time.
8.7.3 Cache Flushing
To free pagecache:
echo 1 > /proc/sys/vm/drop_caches
To free dentries and inodes:
echo 2 > /proc/sys/vm/drop_caches
To free pagecache, dentries and inodes:
echo 3 > /proc/sys/vm/drop_caches
8.8 Tuning
8.8.1 Application Calls
posix_fadvise()
Table 8-9 posix_fadvise() Advice Flags
| Advice | Description |
|---|---|
| POSIX_FADV_SEQUENTIAL | The specified data range will be accessed sequentially. |
| POSIX_FADV_RANDOM | The specified data range will be accessed randomly. |
| POSIX_FADV_NOREUSE | The data will not be reused. |
| POSIX_FADV_WILLNEED | The data will be used again in the near future. |
| POSIX_FADV_DONTNEED | The data will not be used again in the near future. |
madvise()
Table 8-10 madvise() Advice Flags
| Advice | Description |
|---|---|
| MADV_RANDOM | Offsets will be accessed in random order. |
| MADV_SEQUENTIAL | Offsets will be accessed in sequential order. |
| MADV_WILLNEED | Data will be needed again (please cache). |
| MADV_DONTNEED | Data will not be needed again (don’t need to cache). |
8.8.2 ext3
ext4 file systems can be tuned using the tune2fs(8) command.
The noatime option can be used with mount(8) to disable file access timestamp
updates, which will reduce back-end I/O, improving overall performance.
A key option with tune2fs(8) for improving performance is
tune2fs -O dir_index /dev/sdX
This uses hashed B-trees to speed up lookups in large directories.
The e2fsck command can be used to reindex directories in a file system, e.g.:
e2fsck -D -f /dev/sdX
8.9 Exercises
- Answer the following questions about file system terminology:
- What is the difference between logical I/O and physical I/O?
- What is the difference between random and sequential I/O?
- What is direct I/O?
- What is non-blocking I/O?
- What is the working set size?
- Answer the following conceptual questions:
- What is the role of VFS?
- Describe file system latency, specifically where it can be measured from.
- What is the purpose of prefetch (read-ahead)?
- What is the purpose of direct I/O?
- Answer the following deeper questions:
- Describe the advantages of using fsync() over O_SYNC.
- Describe the pros and cons of mmap() over read()s/write()s.
- Describe reasons why logical I/O becomes inflated by the time it becomes physical I/O.
- Describe reasons why logical I/O becomes deflated by the time it becomes physical I/O.
- Explain how file system copy-on-write can improve performance.
- Develop the following procedures for your operating system:
- A file system cache tuning checklist. This should list the file system caches that exist, how to check their current size and usage, and hit rate.
- A workload characterization checklist for file system operations. Include how to fetch each detail, and try to use existing OS observability tools first.
- Perform these tasks:
- Choose an application, and measure file system operations and latency. Include
- The full distribution of file system operation latency, not just the average
- The portion of each second that each application thread spends in file system operations
- Using a micro-benchmark tool, determine the size of the file system cache experimentally. Explain your choices when using the tool. Also show the performance degradation (using any metric) when the working set no longer caches.
- Choose an application, and measure file system operations and latency. Include
- (optional, advanced) Develop an observability tool that provides metrics for synchronous versus asynchronous file system writes. This should include their rate and latency and be able to identify the process ID that issued them, making it suitable for workload characterization.
- (optional, advanced) Develop a tool to provide statistics for indirect and inflated file system I/O: additional bytes and I/O not issued directly by applications. This should break down this additional I/O into different types to explain their reason.
Chapter 9 Disks
9.1 Terminology
- Disk commands: Apart from reads and writes, disks may be commanded to perform other non-data-transfer commands (e.g., cache flush).
- Throughput: With disks, throughput commonly refers to the current data transfer rate, measured in bytes per second.
- Bandwidth: This is the maximum possible data transfer rate for storage transports or controllers.
- I/O latency: time for an I/O operation, used more broadly across the operating system stack and not just at the device level.
- Latency outliers: disk I/O with unusually high latency.
9.2 Models
9.2.1 Simple Disk
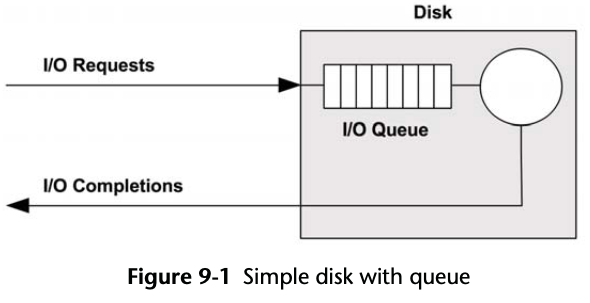 While this may imply a first-come-first-served queue, the on-disk controller can
apply other algorithms to optimize performance. These algorithms could include
elevator seeking for rotational disks, or separate queues for read and write I/O
(especially for flash-memory-based disks).
While this may imply a first-come-first-served queue, the on-disk controller can
apply other algorithms to optimize performance. These algorithms could include
elevator seeking for rotational disks, or separate queues for read and write I/O
(especially for flash-memory-based disks).
9.2.2 Caching Disk
Used for both read and write operation.
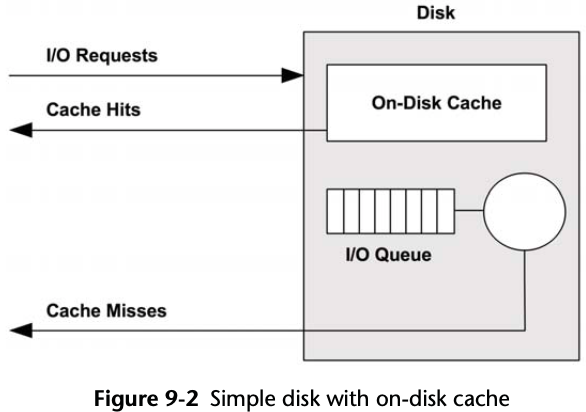
write-back signals writes as having completed after the data transfer to cache and before the slower transfer to persistent disk storage.
write-through cache, completes writes only after the full transfer to the next level.
9.2.3 Controller
9.3 Concepts
9.3.1 Measuring Time
- Service time: the time that an I/O takes to be actively processed (serviced), excluding time waiting on a queue
- Wait time: the time an I/O was waiting on a queue to be serviced
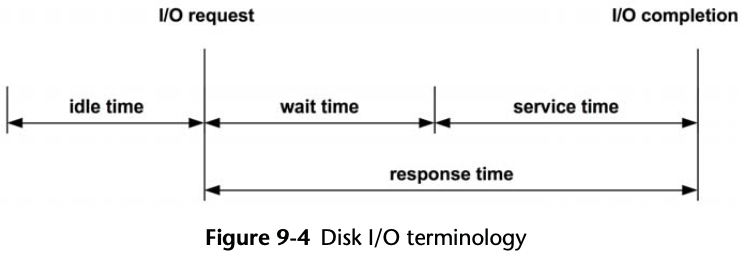
Service time from the block device interface is generally treated as a measure of disk performance (and is what iostat shows).
disk service time = utilization/IOPS
9.3.2 Time Scales
The Scaled column shows a comparison based on an imaginary on-disk cache hit latency of one second.
Table 9-1 Example Time Scale of Disk I/O Latencies
| Event | Latency | Scaled |
|---|---|---|
| On-disk cache hit | <100μs | 1s |
| Flash memory read | ~100 to 1,000 μs (small to large I/O) | 1to10s |
| Rotational disk sequential read | ~1 ms | 10s |
| Rotational disk random read (7,200 rpm) | ~8 ms | 1.3 minutes |
| Rotational disk random read (slow, queueing) | > 10 ms | 1.7 minutes |
| Rotational disk random read (dozens in queue) | > 100 ms | 17 minutes |
| Worst-case virtual disk I/O (hardware controller, RAID-5, queueing, random I/O) | > 1,000 ms | 2.8 hours |
Any disk I/O taking over 10 ms to be unusually slow and a potential source of performance issues.
Since a disk will return a mixture of these(cache hits and cache misses), expressing them together as an average latency (as iostat does) can be misleading, as this is really a distribution with two modes.
9.3.3 Caching
Table 9-2 Disk I/O Caches
| Cache | Example |
|---|---|
| Device cache | ZFS vdev |
| Block cache | buffer cache |
| Disk controller cache | RAID card cache |
| Storage array cache | array cache |
| On-disk cache | disk data controller (DDC) attached DRAM |
9.3.4 Random versus Sequential I/O
Random versus sequential disk I/O patterns were important to study during the era of magnetic rotational disks. For these, random I/O incurs additional latency as the disk heads seek and the platter rotates between I/O. This is shown in Figure 9.5, where both seek and rotation are necessary for the disk heads to move between sectors 1 and 2 (the actual path taken will be as direct as possible). Performance tuning involved identifying random I/O and trying to eliminate it in a number of ways, including caching, isolating random I/O to separate disks, and disk placement to reduce seek distance.
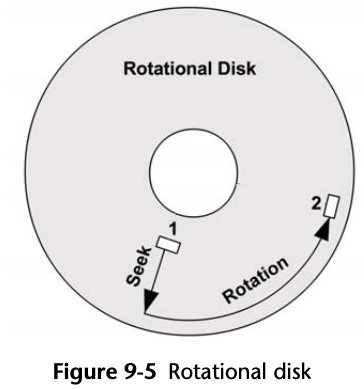
9.3.5 Read/Write Ratio
A system with a high read rate may benefit most from adding cache. A system with a high write rate may benefit most from adding more disks to increase maximum available throughput and IOPS.
The reads and writes may themselves be different workload patterns: reads may be random I/O, while writes may be sequential (especially for copy-on-write file systems). They may also exhibit different I/O sizes.
9.3.6 I/O Size
Larger I/O sizes typically provide higher throughput, although for longer per-I/O latency.
See the Inflated and Deflated sections in Section 8.3.12, Logical versus Physical I/O.
9.3.7 IOPS Are Not Equal
To make sense of IOPS, include the other details: random or sequential, I/O size, read/write. Also consider using time-based metrics, such as utilization and service time, which reflect resulting performance and can be more easily compared.
9.3.8 Non-Data-Transfer Disk Commands
Such as flush cache to disk.
These commands can affect performance and can cause a disk to be utilized while other I/O wait.
9.3.9 Utilization
The exact utilization value that becomes a problem depends on the disk, workload, and latency requirements.
To confirm whether high utilization is causing application issues, study the disk response time and whether the application is blocking on this I/O.
9.3.10 Saturation
It can be calculated as the average length of the device wait queue in the operating system.
This provides a measure of performance beyond the 100% utilization point. A disk at 100% utilization may have no saturation (queueing), or it may have a lot, significantly affecting performance due to the queueing of I/O.
It may be assumed that disks at less than 100% utilization have no saturation. However, this depends on the utilization interval: 50% disk utilization during an interval may mean 100% utilized for half that time and idle for the rest. When it is important to know exactly what occurred, tracing can be used to examine I/O events.
9.3.11 I/O Wait
I/O wait is a per-CPU performance metric showing time spent idle, when there are threads on the CPU dispatcher queue (in sleep state) that are blocked on disk I/O.
If another CPU-hungry process comes along, the I/O wait value can drop.
A more reliable metric may be the time that application threads are blocked on disk I/O. This metric can be measured using static or dynamic tracing.
9.3.12 Synchronous versus Asynchronous
9.3.13 Disk versus Application I/O
9.4 Architecture
9.4.1 Disk Types
Magnetic Rotational
Seek and Rotation
There are many strategies to reduce seek and rotation wait time, including
- Caching: eliminating I/O entirely
- File system placement and behavior, including copy-on-write
- Separating different workloads to different disks, to avoid seeking between workload I/O
- Moving different workloads to different systems (some cloud computing environments can do this to reduce multitenancy effects)
- Elevator seeking, performed by the disk itself
- Higher-density disks, to tighten the workload location
- Partition (or “slice”) configuration, for example, short-stroking
- Use faster disks to reduce rotation wait time.
Disks are available in different rotational speeds, including 5,400, 7,200, 10,000 (10 K), and 15,000 (15 K) revolutions per minute (rpm).
Theoretical Maximum Throughput
max throughput = max sectors per track * sector size * rpm/60 s
Short-Stroking
Short-stroking is where only the outer tracks of the disk are used for the workload;
the remainder are either unused or used for low-throughput workloads (e.g., archives).
The outer tracks usually also have better throughput due to sector zoning.
Sector Zoning
Sector zoning (also called multiple-zone recording) increases the sector count for
the longer tracks, since more sectors can be physically written.
Because the rotation speed is constant, the longer outside-edge tracks deliver
higher throughput (megabytes per second) than the inner tracks.
Sector Size
On-Disk Cache
With SCSI, this is Tagged Command Queueing (TCQ); with SATA, it is called Native
Command Queueing (NCQ).
Elevator Seeking
The elevator algorithm (also known as elevator seeking) improves command queue
efficiency by reordering I/O based on their on-disk location, to minimize travel
of the disk heads.
This makes I/O latency worse in some case, e.g. A disk has been sent a batch of I/O near offset 1,000, and a single I/O at offset 2,000.
While servicing the I/O near 1,000, more arrive near 1,000, and more, and more— enough continual I/O to keep the disk busy near offset 1,000 for 10 s.
ECC
Disks store an error-correcting code at the end of each sector, so the drive can
verify that the data was read correctly and possibly correct some errors.
If the sector was not read correctly, the disk heads may retry the read on the next
rotation (and may retry several times, varying the location
of the head slightly each time).
It may be important to be aware of this in the performance context as a possible
explanation for unusually slow I/O. Investigate operating system and on-disk error
counters to confirm.
Vibration
Shouting at a disk array while performing a write benchmark, caused a burst of
very slow I/O.
Sloth Disks
These disks sometimes return very slow I/O, over one second
, without any reported errors.
Disk Data Controller
Solid-State Drives
Without moving parts, these disks are also physically durable and not susceptible to performance issues caused by vibration.
Flash Memory
Writing data requires erasing an entire block of memory at a time (including multiple
pages, usually 8 KBytes per page) and rewriting the contents. Because of these write
overheads, flash memory has asymmetrical read/write performance: fast reads and slower
writes.
SLC tends to have higher performance when compared to MLC. eMLC is MLC with advanced firmware intended for enterprise use.
Controller
Life Span
Pathologies
- Latency outliers due to aging, and the SSD trying harder to extract correct data (which is checked using ECC)
- Higher latency due to fragmentation (reformatting may fix this by cleaning up the FTL block maps)
- Lower throughput performance if the SSD implements internal compression
9.4.2 Interfaces
Since parallel SCSI is a shared bus, there can be performance issues due to bus contention.
The actual data transfer rate of SAS(Serial Attached SCSI) is 80% of bandwidth, due to 8b/10b encoding.
SATA uses 8b/10b encoding, so the data transfer rate is 80% bandwidth.
9.4.3 Storage Types
Disk Devices
RAID
Storage Arrays
Network-Attached Storage
9.4.4 Operating System Disk I/O Stack
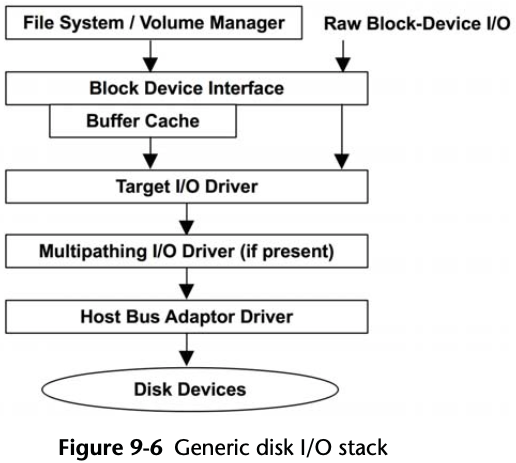
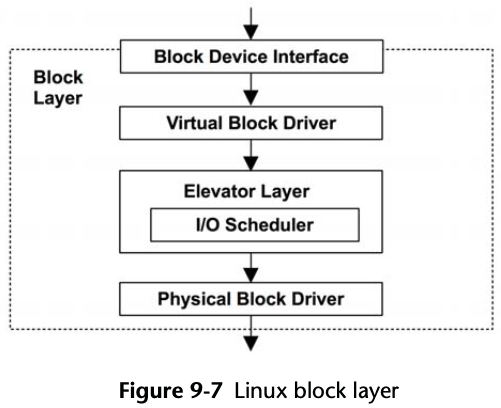
The elevator layer provides generic capabilities to sort, merge, and batch requests
for delivery. These include the elevator seeking algorithm to reduce rotation disk
head travel (sorting of pending I/O based on their location), and methods to merge
and coalesce I/O as shown in Figure 9.8.
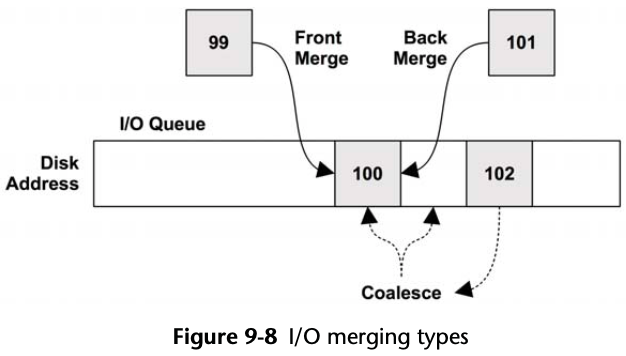
The I/O scheduler allows I/O to be queued and reordered (or rescheduled) for optimized delivery, as determined by an additional scheduling policy.
- Noop: This doesn’t perform scheduling (noop is CPU-talk for no-operation) and can be used when the overhead of scheduling is deemed unnecessary (for example, in a RAMdisk).
- Deadline: attempts to enforce a latency deadline; for example, read and write expiry times in units of milliseconds may be selected. This can be useful for real-time systems, where determinism is desired. It can also solve problems of starvation: where an I/O request is starved of disk resources as newly issued I/O jump the queue, resulting in a latency outlier. Starvation can occur due to writes starving reads, and as a consequence of elevator seeking and heavy I/O to one area of disk starving I/O to another. The deadline scheduler solves this, in part, by using three separate queues for I/O: read FIFO, write FIFO, and sorted. For more internals, see Documentation/block/deadline-iosched.txt.
- Anticipatory: an enhanced version of deadline, with heuristics to anticipate I/O performance, improving global throughput. These can include pausing for milliseconds after reads rather than immediately servicing writes, on the prediction that another read request may arrive during that time for a nearby disk location, thus reducing overall rotational disk head seeks.
- CFQ: The completely fair queueing scheduler allocates I/O time slices to processes, similar to CPU scheduling, for fair usage of disk resources. It also allows priorities and classes to be set for user processes, via the ionice command. See Documentation/block/cfq-iosched.txt.
9.5 Methodology
Table 9-4 Disk Performance Methodologies
| Methodology | Types |
|---|---|
| Tools method | observational analysis |
| USE method | observational analysis |
| Performance monitoring | observational analysis, capacity planning |
| Workload characterization | observational analysis, capacity planning |
| Latency analysis | observational analysis |
| Event tracing | observational analysis |
| Static performance tuning | observational analysis, capacity planning |
| Cache tuning | observational analysis, tuning |
| Resource controls | tuning |
| Micro-benchmarking | experimentation analysis |
| Scaling | capacity planning, tuning |
Use the following strategies, in this order:
- USE method
- performance monitoring
- workload characterization
- latency analysis
- micro-benchmarking
- static analysis
- event tracing
9.5.1 Tools Method
- iostat: using extended mode to look for busy disks (over 60% utilization), high average service times (over, say, 10 ms), and high IOPS (depends)
- iotop: to identify which process is causing disk I/O
- dtrace/stap/perf: including the iosnoop tool to examine disk I/O latency in detail, looking for latency outliers (over, say, 100 ms)
- Disk-controller-specific tools (from the vendor)
9.5.2 USE Method
Disk Devices
- Utilization: the time the device was busy
- Saturation: the degree to which I/O is waiting in a queue
- Errors: device errors
Errors may be checked first. They can be overlooked because the system functions correctly.
Disk Controllers
- Utilization: current versus maximum throughput, and the same for operation rate
- Saturation: the degree to which I/O is waiting due to controller saturation
- Errors: controller errors
Performance of disk controllers and transports is often overlooked. Fortunately, they are not common sources of system bottlenecks, as their capacity typically exceeds that of the attached disks. If total disk throughput or IOPS always levels off at a certain rate, even under different workloads, this may be a clue that the disk controllers or transports are in fact causing problems.
9.5.3 Performance Monitoring
Performance monitoring can identify active issues and patterns of behavior over time. Key metrics for disk I/O are:
- Disk utilization
- Response time
Disk utilization at 100% for multiple seconds is very likely an issue. Depending on your environment, over 60% may also cause poor performance due to increased queueing.
The value for “normal” or “bad” depends on your workload, environment, and latency requirements. If you aren’t sure, micro-benchmarks of known-to-be-good versus bad workloads may be performed to investigate response time (e.g., random versus sequential, small versus large I/O, one tenant versus many).
9.5.4 Workload Characterization
- I/O rate
- I/O throughput
- I/O size
- Random versus sequential
- Read/write ratio
Example:
The system disks have a light random read workload, averaging 350 IOPS with a
throughput of 3 Mbytes/s, running at 96% reads. There are occasional short bursts
of sequential writes, which drive the disks to a maximum of 4,800 IOPS and 560
Mbytes/s. The reads are around 8 Kbytes in size, and the writes around 128 Kbytes.
Advanced Workload Characterization/Checklist
- What is the IOPS rate system-wide? Per disk? Per controller?
- What is the throughput system-wide? Per disk? Per controller?
- Which applications or users are using the disks?
- What file systems or files are being accessed?
- Have any errors been encountered? Were they due to invalid requests, or issues on the disk?
- How balanced is the I/O over available disks?
- What is the IOPS for each transport bus involved?
- What is the throughput for each transport bus involved?
- What non-data-transfer disk commands are being issued?
- Why is disk I/O issued (kernel call path)?
- To what degree is disk I/O application-synchronous?
- What is the distribution of I/O arrival times?
Performance Characterization
- How busy is each disk (utilization)?
- How saturated is each disk with I/O (wait queueing)?
- What is the average I/O service time?
- What is the average I/O wait time?
- Are there I/O outliers with high latency?
- What is the full distribution of I/O latency?
- Are system resource controls, such as I/O throttling, present and active?
- What is the latency of non-data-transfer disk commands?
9.5.5 Latency Analysis
With disks, this will often end at the disk interface: the time between an I/O request and the completion interrupt. If this matches the I/O latency at the application level, it’s usually safe to assume that the I/O latency originates from the disks, allowing you to focus your investigation on them. If the latency differs, measuring it at different levels of the operating system stack will identify the origin.
The latency at each level may be presented as
- Per-interval I/O averages: as typically reported by operating system tools
- Full I/O distributions: as histograms or heat maps
- Per-I/O latency values: see the next section, Event Tracing
The last two are useful for tracking the origin of outliers and can help identify cases where I/O has been split or coalesced.
9.5.6 Event Tracing
- Disk device ID
- I/O type: read or write
- I/O offset: disk location
- I/O size: bytes
- I/O request timestamp: when an I/O was issued to the device (also known as an I/O strategy)
- I/O completion timestamp: when the I/O event completed (completion interrupt)
- I/O completion status: errors
Dynamic tracing may also be used for advanced analysis, and similar trace logs may be captured for the following:
- Block device driver I/O
- Interface driver commands (e.g., sd)
- Disk device driver commands
9.5.7 Static Performance Tuning
- How many disks are present? Of which types?
- What version is the disk firmware?
- How many disk controllers are present? Of which interface types?
- Are disk controller cards connected to high-speed slots?
- What version is the disk controller firmware?
- Is RAID configured? How exactly, including stripe width?
- Is multipathing available and configured?
- What version is the disk device driver?
- Are there operating system bugs/patches for any of the storage device drivers?
- Are there resource controls in use for disk I/O?
9.5.8 Cache Tuning
In summary, check which caches exist, check that they are working, check how well they are working, then tune the workload for the cache and tune the cache for the workload.
9.5.9 Resource Controls
9.5.10 Micro-Benchmarking
Factors for micro-benchmarking include
- Direction: reads or writes
- Disk offset pattern: random or sequential
- Range of offsets: full disk or tight ranges (e.g., offset 0 only)
- I/O size: 512 bytes (typical minimum) up to 1 Mbyte
- Concurrency: number of I/O in flight, or number of threads performing I/O
- Number of devices: single disk tests, or multiple disks (to explore controller and bus limits)
Disks
Micro-benchmarking can be performed on a per-disk basis to determine the following,
along with suggested workloads:
- Maximum disk throughput (megabytes per second): 128 Kbyte reads, sequential
- Maximum disk operation rate (IOPS): 512-byte reads, offset 0 only
- Maximum disk random reads (IOPS): 512-byte reads, random offsets
- Read latency profile (average microseconds): sequential reads, repeat for 512 bytes, 1 K, 2 K, 4 K, and so on
- Random I/O latency profile (average microseconds): 512-byte reads, repeat for full offset span, beginning offsets only, end offsets only
These tests can be repeated for writes. The use of “offset 0 only” is intended to cache the data in the on-disk cache, so that cache access time can be measured.
Disk Controllers
Disk controllers may be micro-benchmarked by applying a workload to multiple disks,
designed to hit limits in the controller. These test may be performed using the
following, along with suggested workloads for the disks:
- Maximum controller throughput (megabytes per second): 128 Kbytes, offset 0 only
- Maximum controller operation rate (IOPS): 512-byte reads, offset 0 only
Apply the workload to the disks one by one, watching for limits. It still may take over a dozen disks to find the limit in a disk controller.
9.5.11 Scaling
9.6 Analysis
Table 9-5 Disk Analysis Tools
| Linux | Description |
|---|---|
| iostat | various per-disk statistics |
| sar | historical disk statistics |
| pidstat, iotop | disk I/O usage by process |
| blktrace | disk I/O event tracing |
| DTrace | custom static and dynamic tracing |
| MegaCli | LSI controller statistics |
| smartctl | disk controller statistics |
9.6.1 iostat
It is typically the first command used to investigate disk I/O issues. The statistics it sources are always maintained by the kernel, so the overhead of this tool is considered negligible.
Table 9-6 iostat Options
| Option | Description |
|---|---|
| -c | display CPU report |
| -d | display disk report |
| -k | use kilobytes instead of (512-byte) blocks |
| -m | use megabytes instead of (512-byte) blocks |
| -p | include per-partition statistics |
| -t | timestamp output |
| -x | extended statistics |
| -z | skip displaying zero-activity summaries |
SCSI devices, are currently not seen by iostat. Also note that, while iostat reports block device reads and writes, it may exclude some other types of disk device commands depending on the kernel (e.g., see the logic in blk_do_io_stat()).
Nonzero counts in the rrqm/s and wrqm/s columns show that contiguous requests were merged before delivery to the device, to improve performance. This metric is also a sign of a sequential workload. The r/s and w/s columns show the requests actually issued to the device.
9.6.2 sar
The sar disk summary is printed using the -d option:
$ sar -d 1
Linux 5.7.8+ (arm-64) 	09/30/2020 	_aarch64_	(8 CPU)

12:15:14 PM       DEV       tps     rkB/s     wkB/s     dkB/s   areq-sz    aqu-sz     await     %util
12:15:15 PM  dev179-0      1.00      0.00      4.00      0.00      4.00      0.00      0.00      0.40
12:15:15 PM dev179-64      0.00      0.00      0.00      0.00      0.00      0.00      0.00      0.00
12:15:15 PM dev179-32      0.00      0.00      0.00      0.00      0.00      0.00      0.00      0.00
12:15:15 PM    dev8-0    115.00   1744.00    568.00      0.00     20.10      2.00     17.39    101.20

12:15:15 PM       DEV       tps     rkB/s     wkB/s     dkB/s   areq-sz    aqu-sz     await     %util
12:15:16 PM  dev179-0      0.00      0.00      0.00      0.00      0.00      0.00      0.00      0.00
12:15:16 PM dev179-64      0.00      0.00      0.00      0.00      0.00      0.00      0.00      0.00
12:15:16 PM dev179-32      0.00      0.00      0.00      0.00      0.00      0.00      0.00      0.00
12:15:16 PM    dev8-0    124.00   1844.00    192.00      0.00     16.42      1.99     16.04     99.60

12:15:16 PM       DEV       tps     rkB/s     wkB/s     dkB/s   areq-sz    aqu-sz     await     %util
12:15:17 PM  dev179-0      0.00      0.00      0.00      0.00      0.00      0.00      0.00      0.00
12:15:17 PM dev179-64      0.00      0.00      0.00      0.00      0.00      0.00      0.00      0.00
12:15:17 PM dev179-32      0.00      0.00      0.00      0.00      0.00      0.00      0.00      0.00
12:15:17 PM    dev8-0    119.00   1660.00    240.00      0.00     15.97      1.94     16.33     97.60
- tps: device data transfers per second
9.6.3 pidstat
pidstat -d 1
Linux 5.7.8+ (arm-64) 	09/30/2020 	_aarch64_	(8 CPU)

12:18:17 PM   UID       PID   kB_rd/s   kB_wr/s kB_ccwr/s iodelay  Command
12:18:18 PM     0     16280     -1.00     -1.00     -1.00      95  kworker/u16:0-events_power_efficient
12:18:18 PM  1000     17959     77.78      0.00      0.00       0  make
12:18:18 PM  1000     18045     25.93      0.00      0.00       0  make
12:18:18 PM  1000     18168    225.93      0.00      0.00      92  cc1
12:18:18 PM  1000     18173     29.63      0.00      0.00      85  cc1
12:18:18 PM  1000     18196    174.07      0.00      0.00      79  cc1
12:18:18 PM  1000     18222    192.59      0.00      0.00      70  cc1
12:18:18 PM  1000     18235    170.37      0.00      0.00      91  cc1
12:18:18 PM  1000     18271    322.22      0.00      0.00      99  make
12:18:18 PM  1000     18294     33.33      0.00      0.00      19  make
12:18:18 PM  1000     18296    100.00      0.00      0.00      56  make
12:18:18 PM  1000     18298     11.11      0.00      0.00      15  make
- kB_rd/s: kilobytes read per second
- kB_wd/s: kilobytes issued for write per second
- kB_ccwr/s: kilobytes canceled for write per second (e.g., overwritten before flush)
Only superusers (root) can access disk statistics for processes that they do not own. These are read via /proc/PID/io.
9.6.4 DTrace
9.6.5 SystemTap
9.6.6 perf
# perf list | grep block:
  block:block_bio_backmerge                          [Tracepoint event]
  block:block_bio_bounce                             [Tracepoint event]
  block:block_bio_complete                           [Tracepoint event]
  block:block_bio_frontmerge                         [Tracepoint event]
  block:block_bio_queue                              [Tracepoint event]
  block:block_bio_remap                              [Tracepoint event]
  block:block_dirty_buffer                           [Tracepoint event]
  block:block_getrq                                  [Tracepoint event]
  block:block_plug                                   [Tracepoint event]
  block:block_rq_complete                            [Tracepoint event]
  block:block_rq_insert                              [Tracepoint event]
  block:block_rq_issue                               [Tracepoint event]
  block:block_rq_remap                               [Tracepoint event]
  block:block_rq_requeue                             [Tracepoint event]
  block:block_sleeprq                                [Tracepoint event]
  block:block_split                                  [Tracepoint event]
  block:block_touch_buffer                           [Tracepoint event]
  block:block_unplug                                 [Tracepoint event]
# perf record -age block:block_rq_issue sleep 10
[ perf record: Woken up 1 times to write data ]
[ perf record: Captured and wrote 0.280 MB perf.data (100 samples) ]
# perf report -g | more
[...]
     0.39%     0.39%  179,0 RM 4096 () 6639144 + 8 [aarch64-linux-g]
            |
            ---0xaaaabce61460
               __libc_start_main
               0xaaaabce61344
               0xaaaabce63228
               bfd_close
               0xffff8534d020
               bfd_check_format_matches
               0xffff853c6794
               __GI___getdents64
               el0_sync
               el0_sync_handler
               el0_svc
               do_el0_svc
               el0_svc_common.constprop.3
               __arm64_sys_getdents64
               ksys_getdents64
               iterate_dir
               ext4_readdir
               ext4_htree_fill_tree
               htree_dirblock_to_tree
               __ext4_read_dirblock
               ext4_bread
               ll_rw_block
               submit_bh_wbc
               submit_bio
               generic_make_request
               blk_mq_make_request
               blk_mq_try_issue_directly
               __blk_mq_try_issue_directly
               mmc_mq_queue_rq
               blk_mq_start_request
               blk_mq_start_request
[...]
9.6.7 iotop
iotop is based on kernel accounting statistics. iotop requires kernel with the following options enabled:
CONFIG_TASK_DELAY_ACCT
CONFIG_TASK_IO_ACCOUNTING
CONFIG_TASKSTATS
CONFIG_VM_EVENT_COUNTERS
9.6.8 iosnoop
iosnoop is a short DTrace script.
9.6.9 blktrace
blktrace enables kernel block driver tracing and retrieves the raw trace data, which can be processed using blkparse to produce readable output. For convenience, the btrace tool runs both blktrace and blkparse, such that the following are equivalent:
# blktrace -d /dev/sda -o - | blkparse -i -
# btrace /dev/sda
Action Identifiers
These are described in the blkparse man page:
A IO was remapped to a different device
B IO bounced
C IO completion
D IO issued to driver
F IO front merged with request on queue
G Get request
I IO inserted onto request queue
M IO back merged with request on queue
P Plug request
Q IO handled by request queue code
S Sleep request
T Unplug due to timeout
U Unplug request
X Split
Action Filtering
The blktrace and btrace commands can filter actions to show only the event type
of interest. For example, to trace only the D actions (I/O issued), use the filter
option -a issue:
# btrace -a issue /dev/sda
  8,0    2        1     0.000000000   383  D  RM 709226504 + 8 [kworker/2:1H]
  8,0    4        1     0.010511758  7823  D  WS 709730920 + 80 [ThreadPoolForeg]
  8,0    4        2     0.019066515   318  D  WS 600619720 + 136 [kworker/4:1H]
  8,0    4        3     0.019541967   691  D  FN [jbd2/sda4-8]
  8,0    4        4     0.042088023     0  D  WS 600619856 + 8 [swapper/4]
  8,0    4        5     0.042189936     0  D  FN [swapper/4]
Other filters are described in the blktrace man page, such as trace only reads (-a read), writes (-a write), or synchronous operations (-a sync).
9.6.10 MegaCli
Patrol read can affect performance.
9.6.11 smartctl
9.6.12 Visualizations
Line Graphs
Performance monitoring solutions commonly graph disk IOPS, throughput, and utilization
measurements over time as line graphs. This helps illustrate time-based patterns,
such as changes in load during the day, or recurring events such as file system flush
intervals.
Note the metric that is being graphed. Averages across all disk devices can hide unbalanced behavior, including single device outliers. Averages across long time periods can also hide shorter-term fluctuations.
Scatter Plots
Offset Heat Maps
- DTraceTazTool
- taztool
- seekwatcher
Latency Heat Maps
Utilization Heat Maps
9.7 Experimentation
When using these tools, it’s a good idea to leave iostat continually running so that any result can be immediately double-checked.
9.7.1 Ad Hoc
Testing sequential read with a 1 MB I/O size:
# dd if=/dev/mmcblk1 of=/dev/null bs=1024k count=1k
1024+0 records in
1024+0 records out
1073741824 bytes (1.1 GB, 1.0 GiB) copied, 6.66769 s, 161 MB/s

# dd if=/dev/sda1 of=/dev/null bs=1024k count=1k
1024+0 records in
1024+0 records out
1073741824 bytes (1.1 GB, 1.0 GiB) copied, 34.4525 s, 31.2 MB/s
9.7.2 Custom Load Generators
A custom load generator can be a short C program that opens the device path and applies the intended workload. The block special devices files can be opened with O_DIRECT, to avoid buffering.
9.7.3 Micro-Benchmark Tools
hdparm provides a command line interface to various kernel interfaces supported by the Linux SATA/PATA/SAS “libata” subsystem and the older IDE driver subsystem. Many newer (2008 and later) USB drive enclosures now also support “SAT” (SCSI-ATA Command Translation) and therefore may also work with hdparm.
# hdparm -Tt /dev/sdb
The -T option tests cached reads, and -t tests disk device reads.
9.7.4 Random Read Example
9.8 Tuning
9.8.1 Operating System Tunables
ionice
ionice can be used to set an I/O scheduling class and priority for a process.
- 0, none: no class specified, so the kernel will pick a default—best effort, with a priority based on the process nice value.
- 1, real-time: highest-priority access to the disk. If misused, this can starve other processes (just like the RT CPU scheduling class).
- 2, best effort: default scheduling class, supporting priorities 0–7, with 0 the highest.
- 3, idle: disk I/O allowed only after a grace period of disk idleness.
# ionice -c 3 -p 1623
This puts process ID 1623 in the idle I/O scheduling class. This may be desirable for long-running backup jobs, so that they are less likely to interfere with the production workload.
Resource Controls
The container groups (cgroups) block I/O (blkio) subsystem provides storage device
resource controls for processes or process groups. This can be a proportional weight
(like a share) or a fixed limit. Limits can be set for read and write independently,
and for either IOPS or throughput (bytes per second).
$ ls /sys/fs/cgroup/blkio
blkio.bfq.io_service_bytes            blkio.throttle.io_service_bytes_recursive  blkio.throttle.write_iops_device  release_agent
blkio.bfq.io_service_bytes_recursive  blkio.throttle.io_serviced                 cgroup.clone_children             system.slice
blkio.bfq.io_serviced                 blkio.throttle.io_serviced_recursive       cgroup.procs                      tasks
blkio.bfq.io_serviced_recursive       blkio.throttle.read_bps_device             cgroup.sane_behavior              user.slice
blkio.reset_stats                     blkio.throttle.read_iops_device            init.scope
blkio.throttle.io_service_bytes       blkio.throttle.write_bps_device            notify_on_release
Tunable Parameters
Available I/O scheduler are:
$ cat /sys/block/mmcblk1/queue/scheduler
[none] mq-deadline kyber bfq
9.8.2 Disk Device Tunables
Not related to Android.
9.8.3 Disk Controller Tunables
Not related to Android.
9.9 Exercises
- Answer the following questions about disk terminology:
- What are IOPS?
- What is disk I/O response time?
- What is the difference between service time and wait time?
- What is a latency outlier?
- What is a non-data-transfer disk command?
- Answer the following conceptual questions:
- Describe disk utilization and saturation.
- Describe the performance differences between random and sequential disk I/O.
- Describe the role of an on-disk cache for read and write I/O.
- Answer the following deeper questions:
- Explain why utilization (percent busy) of virtual disks can be misleading.
- Explain why the “I/O wait” metric can be misleading.
- Describe performance characteristics of RAID-0 (striping) and RAID-1 (mirroring).
- Describe what happens when disks are overloaded with work, including the effect on application performance.
- Describe what happens when the storage controller is overloaded with work (either throughput or IOPS), including the effect on application performance.
- Develop the following procedures for your operating system:
- A USE method checklist for disk resources (disks and controllers). Include how to fetch each metric (e.g., which command to execute) and how to interpret the result. Try to use existing OS observability tools before installing or using additional software products.
- A workload characterization checklist for disk resources. Include how to fetch each metric, and try to use existing OS observability tools first.
- Describe disk behavior visible in this Linux iostat output alone:
$ iostat -x 1 [...] avg-cpu: %user %nice %system %iowait %steal %idle 3.23 0.00 45.16 31.18 0.00 20.43 Device: rrqm/s wrqm/s r/s w/s rkB/s wkB/s avgrq-sz avgqu-sz await r_await w_await svctm %util vda 39.78 13156.99 800.00 151.61 3466.67 41200.00 93.88 11.99 7.49 0.57 44.01 0.49 46.56 vdb 0.00 0.00 0.00 0.00 0.00 0.00 0.00 0.00 0.00 0.00 0.00 0.00 0.00 - (optional, advanced) Develop a tool to trace all disk commands except for reads and writes. This may require tracing at the SCSI level.