
python stacked bar graph example
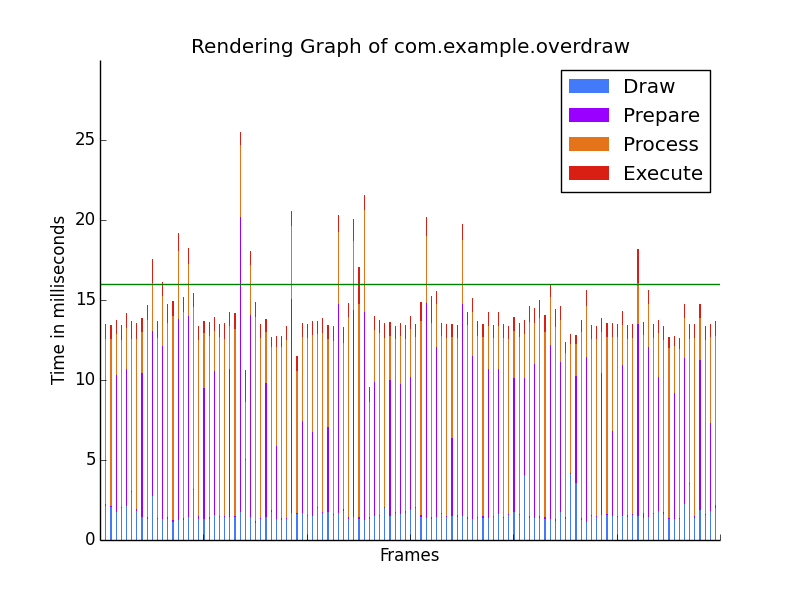
When debugging android GPU rendering issue, plotting timing data to stacked bar graph was the best way to visualize the potential rendering issue.
Following code was adapted from Stacked Bar Graph for this purpose:
import re
import sys
import numpy as np
import matplotlib.pyplot as plt

def plot_rendering_graph(frames, apk):
    title = "Rendering Graph of " + apk
    num_frames = len(frames)
    idx = np.arange(num_frames) # the x location

    p0 = np.array(zip(*frames)[0])
    p1 = np.array(zip(*frames)[1])
    p2 = np.array(zip(*frames)[2])
    p3 = np.array(zip(*frames)[3])
    width = 0.25       # the width of the bars: can also be len(x) sequence

    segment_draw = plt.bar(idx, p0, width,
                           linewidth=0,
                           color='#427af9')

    segment_prepare = plt.bar(idx, p1, width,
                              linewidth=0,
                              color='#9900ff',
                              bottom=p0)
    segment_process = plt.bar(idx, p2, width,
                              linewidth=0,
                              color='#e47319',
                              bottom=p0+p1)
    segment_execute = plt.bar(idx, p3, width,
                              linewidth=0,
                              color='#d91e14',
                              bottom=p0+p1+p2)

    frame_max = np.amax(p0+p1+p2+p3)
    ymax = frame_max if frame_max > 16 else 20

    plt.title(title)
    plt.xlabel('Frames')
    plt.ylabel('Time in milliseconds')
    plt.tick_params(labelbottom=False, # Hide bottom tick labels
                    top=False,         # Hide top ticks
                    right=False)       # Hide right ticks

    # Draw 16ms warning line
    plt.axhline(y=16, lw=1, color='green')

    # Hide the right and top spines
    plt.gca().spines['right'].set_visible(False)
    plt.gca().spines['top'].set_visible(False)

    plt.yticks(np.arange(0, ymax, 5))
    plt.legend((segment_draw[0], segment_prepare[0],
                segment_process[0], segment_execute[0]),
                ('Draw', 'Prepare', 'Process', 'Execute'))

    graph_name = apk + '.png'
    plt.savefig(graph_name)

    plt.show()

def parse_gfxinfo(filename):
    """ Parse the results of dumpsys gfxinfo """

    """ Holding timing inforamtion"""
    """ format: Draw	Prepare	Process	Execute """
    frames = []

    with open(filename, 'r') as gfxinfo:
        for line in gfxinfo:
            pkg = re.search(r'\[([^]]+)', line)
            if pkg is not None:
                apk = pkg.group(1)

            t = re.split(r'\t+', line.strip('^\t|\n$'))
            if len(t) == 4:
                frames.append(t)

    # remove segment header
    frames = np.delete(frames, 0, axis=0)
    return np.array(frames, dtype=float), apk

if __name__ == "__main__":
    frames, apk = parse_gfxinfo(sys.argv[1])
    if len(frames) > 1:
        plot_rendering_graph(frames, apk)
    else:
        print "No frame data found"