
Tracing kernel using ftrace
Ftrace
What is ftrace?
Ftrace is a tracing utility built directly into the Linux kernel. The interface for Ftrace resides in the debugfs file system in the tracing directory. Official Documentation can be found in the Linux kernel source tree at Documentation/trace/ftrace.txt
Kernel Configuration
CONFIG_FUNCTION_TRACER
CONFIG_FUNCTION_GRAPH_TRACER
CONFIG_STACK_TRACER
CONFIG_DYNAMIC_FTRACE
Note, the following options:
CONFIG_HAVE_FUNCTION_TRACER
CONFIG_HAVE_DYNAMIC_FTRACE
CONFIG_HAVE_FUNCTION_GRAPH_TRACER
are enabled when the architecture supports the corresponding feature. Do not confuse them with the listed options. The features are only enabled when the listed configuration options are enabled and not when only the HAVE options are.
Function tracer uses -pg option of gcc to have every function in the kernel call a special function “mcount()”, which will cause a slight overhead because of the addition of frame pointers that come with the -pg option.
What can ftrace do?
rpi3:/d/tracing # cat available_tracers
blk function_graph wakeup_dl wakeup_rt wakeup preemptirqsoff preemptoff irqsoff
function nop
There are nine tracers built into raspberrypi3 kernel, these are:
- blk: The block tracer. The tracer used by the blktrace user application.
- function: Function call tracer to trace all kernel functions.
- function_graph: traces on both entry and exit of the functions.
- wakeup: Traces and records the max latency that it takes for the highest priority task to get scheduled after it has been woken up.
- wakeup_rt: Traces and records the max latency that it takes for just RT tasks
- wakeup_dl: Traces and records the max latency that it takes for a SCHED_DEADLINE task to be woken
- irqsoff: Traces the areas that disable interrupts and saves the trace with the longest max latency.
- preemptsoff: Similar to irqsoff but traces and records the amount of time for which preemption is disabled.
- preemptirqsoff: Similar to irqsoff and preemptoff, but traces and records the largest time for which irqs and/or preemption is disabled.
Refer to Documentation/trace/ftrace.txt for more tracers that not enabled by this kernel configuration.
function tracer
rpi3:/d/tracing # echo function > current_tracer
rpi3:/d/tracing # cat current_tracer
function

rpi3:/d/tracing # echo 1 > tracing_on
rpi3:/d/tracing # cat trace | head -20
# tracer: function
#
#                              _-----=> irqs-off
#                             / _----=> need-resched
#                            | / _---=> hardirq/softirq
#                            || / _--=> preempt-depth
#                            ||| /     delay
#           TASK-PID   CPU#  ||||    TIMESTAMP  FUNCTION
#              | |       |   ||||       |         |
          <idle>-0     [003] d..1   490.568451: bcm2836_arm_irqchip_handle_irq <-__irq_svc
          <idle>-0     [003] d..1   490.568455: arm_heavy_mb <-bcm2836_arm_irqchip_handle_irq
          <idle>-0     [003] d..1   490.568457: handle_IPI <-bcm2836_arm_irqchip_handle_irq
          <idle>-0     [003] d..1   490.568459: scheduler_ipi <-handle_IPI
          <idle>-0     [003] d..1   490.568461: irq_enter <-scheduler_ipi
          <idle>-0     [003] d..1   490.568462: rcu_irq_enter <-irq_enter
          <idle>-0     [003] d..1   490.568464: rcu_dynticks_eqs_exit <-rcu_irq_enter
          <idle>-0     [003] d..1   490.568466: __local_bh_disable_ip <-irq_enter
          <idle>-0     [003] d..1   490.568467: tick_irq_enter <-irq_enter
          <idle>-0     [003] d..1   490.568469: tick_check_oneshot_broadcast_this_cpu <-tick_irq_enter
          <idle>-0     [003] d..1   490.568471: ktime_get <-tick_irq_enter
function_graph tracer
rpi3:/d/tracing # echo function_graph > current_tracer
rpi3:/d/tracing # cat trace | head -20
# tracer: function_graph
#
# CPU  DURATION                  FUNCTION CALLS
# |     |   |                     |   |   |   |
 1)   0.521 us    |                } /* vma_compute_subtree_gap */
 1)   6.510 us    |              } /* vma_gap_callbacks_rotate */
 1) ! 107.500 us  |            } /* __vma_link_rb */
 1)               |            __vma_link_file() {
 1)               |              _raw_spin_lock_irq() {
 1)   0.782 us    |                preempt_count_add();
 1)   5.312 us    |              }
 1)   1.927 us    |              vma_interval_tree_insert();
 1)               |              _raw_spin_unlock_irq() {
 1)   0.677 us    |                preempt_count_sub();
 1)   5.052 us    |              }
 1) + 24.323 us   |            }
 1)   0.520 us    |            up_write();
 1) ! 152.396 us  |          } /* vma_link */
 1)   0.573 us    |          vm_stat_account();
 1)   0.573 us    |          uprobe_mmap();
The DURATION column shows the time spent in the corresponding function. The function graph tracer records the time the function was entered and exited and reports the difference as the duration. These numbers only appear with the leaf functions and the “}” symbol.
Note that this time also includes the overhead of all functions within a nested function as well as the overhead of the function graph tracer itself. The function graph tracer hijacks the return address of the function in order to insert a trace callback for the function exit. This breaks the CPU’s branch prediction and causes a bit more overhead than the function tracer. The closest true timings only occur for the leaf functions.
The marks in the above command result has the following meanings:
  '$' - greater than 1 second
  '@' - greater than 100 milisecond
  '*' - greater than 10 milisecond
  '#' - greater than 1000 microsecond
  '!' - greater than 100 microsecond
  '+' - greater than 10 microsecond
  ' ' - less than or equal to 10 microsecond.
Using trace_printk()
printk() is the king of all debuggers, but it has a problem. If you are debugging a high volume area such as the timer interrupt, the scheduler, or the network, printk() can lead to bogging down the system or can even create a live lock. It is also quite common to see a bug “disappear” when adding a few printk()s. This is due to the sheer overhead that printk() introduces.
Ftrace introduces a new form of printk() called trace_printk(). It can be used just like printk(), and can also be used in any context (interrupt code, NMI code, and scheduler code). What is nice about trace_printk() is that it does not output to the console. Instead it writes to the Ftrace ring buffer and can be read via the trace file.
Writing into the ring buffer with trace_printk() only takes around a tenth of a microsecond or so. But using printk(), especially when writing to the serial console, may take several milliseconds per write. The performance advantage of trace_printk() lets you record the most sensitive areas of the kernel with very little impact.
Disabling ftrace
tracing_on
rpi3:/d/tracing # echo 0 > tracing_on
This will disable the Ftrace ring buffer from recording. Everything else still happens with the tracers and they will still incur most of their overhead. They do notice that the ring buffer is not recording and will not attempt to write any data, but the calls that the tracers make are still performed.
ftrace_enabled
Note, the proc sysctl ftrace_enable is a big on/off switch for the function
tracer. By default it is enabled (when function tracing is enabled in the kernel).
If it is disabled, all function tracing is disabled. This includes not only the
function tracers for ftrace, but also for any other uses (perf, kprobes, stack
tracing, profiling, etc).
Please disable this with care.
This can be disabled (and enabled) with:
rpi3:/d/tracing # sysctl kernel.ftrace_enabled=0
rpi3:/d/tracing # sysctl kernel.ftrace_enabled=1
or
rpi3:/d/tracing # echo 0 > /proc/sys/kernel/ftrace_enabled
rpi3:/d/tracing # echo 1 > /proc/sys/kernel/ftrace_enabled
Disabling ftrace within kernel
You may wanna disable ftrace in kernel during the development of driver. There
are two functions inside the kernel: tracing_on() and tracing_off() for which
act just as we echoing ‘1’ or ‘0’ into tracing_on file.
Trace Marker
trace_marker was used to synchronize between the actions in user space and kernel space.
rpi3:/d/tracing # echo nop > current_tracer
rpi3:/d/tracing # echo hello world > trace_marker
rpi3:/d/tracing # cat trace
# tracer: nop
#
#                              _-----=> irqs-off
#                             / _----=> need-resched
#                            | / _---=> hardirq/softirq
#                            || / _--=> preempt-depth
#                            ||| /     delay
#           TASK-PID   CPU#  ||||    TIMESTAMP  FUNCTION
#              | |       |   ||||       |         |
              sh-307   [000] ....  5493.548616: tracing_mark_write: hello world
Tracing kernel crash
ftrace_dump_on_oops was used for kernel crash debugging, it will dump the entire ftrace buffer to the console in ASCII format on kernel panic or oops. ftrace_dump_on_oops can be enabled via command line or add ftrace_dump_on_oops to kernel boot cmdline.
rpi3:/d/tracing # sysctl kernel.ftrace_dump_on_oops=1
kernel.ftrace_dump_on_oops = 1
Dumping the whole ftrace buffer maybe time-consuming depends on the buffer size of the ftrace, you can changed the default buffer size through buffer_size_kb file:
rpi3:/d/tracing # echo 10 > buffer_size_kb
The ftrace trace buffer are the same size for each CPU by default, so the above echoing to buffer_size_kb will make the buffer_total_size_kb increase fourfold since raspberry PI 3 has 4 CPUs on chip.
rpi3:/d/tracing # cat buffer_total_size_kb
40
Buffer size for individual CPUs may vary, in this case the buffer_size_kb will show ‘X’ when doing cat.
rpi3:/d/tracing # echo 7 > per_cpu/cpu0/buffer_size_kb
rpi3:/d/tracing # cat buffer_size_kb
X
rpi3:/d/tracing # cat buffer_total_size_kb
37
Stack Tracing
Enabling stack trace Stack tracing can be eanbled with sysctrl or echoing:
rpi3:/d/tracing # sysctl kernel.stack_tracer_enabled=1
kernel.stack_tracer_enabled = 1
or
rpi3:/d/tracing # echo 1 > /proc/sys/kernel/stack_tracer_enabled
rpi3:/d/tracing # cat stack_max_size
2592
rpi3:/d/tracing # cat stack_trace
        Depth    Size   Location    (38 entries)
        -----    ----   --------
  0)     2648       4   __wake_up_common+0x18/0x144
  1)     2644     132   __wake_up_common_lock+0x88/0xac
  2)     2512      24   __wake_up+0x24/0x2c
  3)     2488      24   tty_wakeup+0x38/0x6c
  4)     2464      24   tty_port_default_wakeup+0x24/0x30
  5)     2440      16   tty_port_tty_wakeup+0x20/0x24
  6)     2424      16   uart_write_wakeup+0x24/0x2c
  7)     2408      32   serial8250_tx_chars+0x1e8/0x1fc
[...]
 25)     1808      32   bcm2836_arm_irqchip_handle_irq+0xa8/0xac
 26)     1776      68   __irq_svc+0x70/0xb0
 27)     1708      28   _raw_spin_unlock_irq+0x34/0x68
 28)     1680      72   finish_task_switch+0x8c/0x220
 29)     1608      28   __schedule+0x34c/0x98c
 30)     1580      84   schedule+0x58/0xb8
 31)     1496     120   schedule_hrtimeout_range_clock+0x12c/0x134
 32)     1376      24   schedule_hrtimeout_range+0x28/0x30
 33)     1352      32   poll_schedule_timeout+0x54/0x84
 34)     1320     776   do_select+0x57c/0x694
 35)      544     336   core_sys_select+0x24c/0x48c
 36)      208     112   SyS_pselect6+0x344/0x36c
 37)       96      96   ret_fast_syscall+0x0/0x28
do_select had the biggest stack with 776 bytes being used in the above result.
Please be noted that the stack tracer has no overhead only when it is not enabled. When it is running you may notice a bit of a performance degradation.
Enabling the stack tracer (CONFIG_STACK_TRACER) will show where the biggest use of the stack takes place. The stack tracer is built from the function tracer infrastructure. It does not use the Ftrace ring buffer.
To see the max stack size during boot up, add “stacktrace” to the kernel command line.
Note that the stack tracer will not trace the max stack size when the kernel is using a separate stack. Because interrupts have their own stack, it will not trace the stack usage there.
Filtering with ftrace
There are two files that can be used for function filtering:
set_ftrace_filter
set_ftrace_notrace
Only those functions listed in set_ftrace_filter will be traced, this will help to reduce the impact to the performance of system when the function tracer is activated.
The set_ftrace_notrace file is the opposite of set_ftrace_filter. Instead of limiting the trace to a set of functions, functions listed in set_ftrace_notrace will not be traced. Functions such as rcu_read_lock() and spin_lock() fall into this category.
To remove all functions just echo a bland line into the filter file will be ok.
rpi3:/d/tracing # echo > set_ftrace_notrace
rpi3:/d/tracing # cat set_ftrace_notrace
rpi3:/d/tracing #
The functions listed in these files can also be set on the kernel command line. The options ftrace_notrace and ftrace_filter will preset these files by listing a comma delimited set of functions.
ftrace_notrace=rcu_read_lock,rcu_read_unlock,spin_lock,spin_unlock ftrace_filter=kfree,kmalloc,schedule,vmalloc_fault,spurious_fault
Functions added by the kernel command line set what will be in the corresponding filter files. These options only pre-load the files, functions can still be removed or added using the bash redirection.
The functions listed in set_ftrace_notrace take precedence. That is, if a function is listed in both set_ftrace_notrace and set_ftrace_filter, that function will not be traced.
trace-cmd - utilities for Linux ftrace
Install from source code
cd /tmp/
git clone https://github.com/rostedt/trace-cmd.git
cd trace-cmd
sudo apt-get install libgtk2.0-dev -y
sudo apt-get install libxml2-dev -y
make gui&&sudo make install_gui
make install_gui will also install kernelshark to the system.
Build for android
sudo apt-get install gcc-arm-linux-gnueabi
make LDFLAGS=-static CC=arm-linux-gnueabi-gcc trace-cmd
Copy tracecmd/trace-cmd to target rootfs.
Note, do not try to build trace-cmd in MacOS
This section illustrates how to use trace-cmd to record a kernel trace, command without parameters will show what we can do with trace-cmd:
rpi3:/d/tracing # trace-cmd

trace-cmd version 2.8.dev

usage:
  trace-cmd [COMMAND] ...

  commands:
     record - record a trace into a trace.dat file
     start - start tracing without recording into a file
     extract - extract a trace from the kernel
     stop - stop the kernel from recording trace data
     restart - restart the kernel trace data recording
     show - show the contents of the kernel tracing buffer
     reset - disable all kernel tracing and clear the trace buffers
     clear - clear the trace buffers
     report - read out the trace stored in a trace.dat file
     stream - Start tracing and read the output directly
     profile - Start profiling and read the output directly
     hist - show a historgram of the trace.dat information
     stat - show the status of the running tracing (ftrace) system
     split - parse a trace.dat file into smaller file(s)
     options - list the plugin options available for trace-cmd report
     listen - listen on a network socket for trace clients
     list - list the available events, plugins or options
     restore - restore a crashed record
     snapshot - take snapshot of running trace
     stack - output, enable or disable kernel stack tracing
     check-events - parse trace event formats
For detailed infomation about subcommand, issue trace-cmd subcommand –help
Recording a trace
rpi3:/ # trace-cmd record --help

trace-cmd version 2.8.dev

usage:
 trace-cmd record [-v][-e event [-f filter]][-p plugin][-F][-d][-D][-o file] \
           [-q][-s usecs][-O option ][-l func][-g func][-n func] \
           [-P pid][-N host:port][-t][-r prio][-b size][-B buf][command ...]
           [-m max][-C clock]
          -e run command with event enabled
          -f filter for previous -e event
          -R trigger for previous -e event
          -p run command with plugin enabled
          -F filter only on the given process
          -P trace the given pid like -F for the command
          -c also trace the childen of -F (or -P if kernel supports it)
          -C set the trace clock
          -T do a stacktrace on all events
          -l filter function name
          -g set graph function
          -n do not trace function
          -m max size per CPU in kilobytes
          -M set CPU mask to trace
          -v will negate all -e after it (disable those events)
          -d disable function tracer when running
          -D Full disable of function tracing (for all users)
          -o data output file [default trace.dat]
          -O option to enable (or disable)
          -r real time priority to run the capture threads
          -s sleep interval between recording (in usecs) [default: 1000]
          -S used with --profile, to enable only events in command line
          -N host:port to connect to (see listen)
          -t used with -N, forces use of tcp in live trace
          -b change kernel buffersize (in kilobytes per CPU)
          -B create sub buffer and folling events will be enabled here
          -k do not reset the buffers after tracing.
          -i do not fail if an event is not found
          -q print no output to the screen
          --quiet print no output to the screen
          --module filter module name
          --by-comm used with --profile, merge events for related comms
          --profile enable tracing options needed for report --profile
          --func-stack perform a stack trace for function tracer
             (use with caution)
          --max-graph-depth limit function_graph depth
When recording a trace, trace-cmd will fork off a process for each CPU on the system. Each of these processes will open the file in debugfs that represents the CPU the process is dedicated to record from. The process recording CPU0 will open /sys/kernel/debug/tracing/per_cpu/cpu0/trace_pipe_raw, the process recording CPU1 will open a similar file in the cpu1 directory, and so on. The trace_pipe_raw file is a mapping directly to the Ftrace internal buffer for each CPU. Each of these CPU processes will read these files using splice to record into a temporary file during the trace. At the end of the record, the main process will concatenate the temporary files into a single trace.dat file.
There’s no need to manually mount the debugfs filesystem before using the tool as trace-cmd will look to see if and where it is mounted. If debugfs is not mounted, it will automatically mount it at /sys/kernel/debug.
As trace-cmd is a front end to Ftrace, the arguments of record reflect some of the
features of Ftrace. The -e option enables an event. The argument following the -e
can be an event name, event subsystem name, or the special name all. The all name
will make trace-cmd enable all events that the system supports. If a subsystem name
is specified, then all events under that subsystem will be enabled during the trace.
For example, specifying sched will enable all the events within the sched subsystem.
To enable a single event, the event name can be used by itself, or the subsystem:event
format can be used. If more than one event or subsystem is to be traced, then multiple
-e options may be specified.
To show the events system supports, use list subcommand with -e option.
Ftrace also has special plugin tracers that do not simply trace specific events. These tracers include the function, function graph, and latency tracers. Through the debugfs tracing directory, these plugins are enabled by echoing the type of tracer into the current_tracer file. With trace-cmd record, they are enabled with the -p option. Using the tracer plugin name as the argument for -p enables that plugin. You can still specify one or more events with a plugin, but you may only specify a single plugin, or no plugin at all.
Reading trace file
rpi3:/d/tracing # trace-cmd report --help

trace-cmd version 2.8.dev

usage:
 trace-cmd report [-i file] [--cpu cpu] [-e][-f][-l][-P][-L][-N][-R][-E]\
           [-r events][-n events][-F filter][-v][-V][-T][-O option]
           [-H [start_system:]start_event,start_match[,pid]/[end_system:]end_event,end_match[,flags]
           [-G]
          -i input file [default trace.dat]
          -e show file endianess
          -f show function list
          -P show printk list
          -E show event files stored
          -F filter to filter output on
          -I filter out events with the HARDIRQ flag set
          -S filter out events with the SOFTIRQ flag set
          -t print out full timestamp. Do not truncate to 6 places.
          -R raw format: ignore print format and only show field data
          -r raw format the events that match the option
          -v will negate all -F after it (Not show matches)
          -T print out the filter strings created and exit
          -V verbose (shows plugins being loaded)
          -L load only local (~/.trace-cmd/plugins) plugins
          -N do not load any plugins
          -n ignore plugin handlers for events that match the option
          -w show wakeup latencies
          -l show latency format (default with latency tracers)
          -O plugin option -O [plugin:]var[=val]
          --check-events return whether all event formats can be parsed
          --stat - show the buffer stats that were reported at the end of the record.
          --uname - show uname of the record, if it was saved
          --profile report stats on where tasks are blocked and such
          -G when profiling, set soft and hard irqs as global
          -H Allows users to hook two events together for timings
             (used with --profile)
          --by-comm used with --profile, merge events for related comms
          --ts-offset will add amount to timestamp of all events of the
                     previous data file.
          --ts2secs HZ, pass in the timestamp frequency (per second)
                     to convert the displayed timestamps to seconds
                     Affects the previous data file, unless there was no
                     previous data file, in which case it becomes default
           --ts-diff Show the delta timestamp between events.
By default trace-cmd report read trace.data file, if using different trace file, use -i option, or just put the trace file as the last argument, the following two will show the same result:
rpi3:/d/tracing # trace-cmd report -i /data/mytrace.data
rpi3:/d/tracing # trace-cmd report /data/mytrace.data
With trace.data file we can easily filter what events we want or pick a specific CPU to see:
rpi3:/data # trace-cmd record -e kmem
rpi3:/data # trace-cmd report --cpu 0 -F 'kmalloc: bytes_req > 1000'                         <
CPU 1 is empty
cpus=4
 jbd2/mmcblk0p4--114   [000]  1876.824662: kmalloc:              call_site=c076dc54 ptr=0xd6d77000 bytes_req=2048 bytes_alloc=2048 gfp_flags=GFP_NOWAIT|__GFP_NOWARN|__GFP_NORETRY|__GFP_NOMEMALLOC
 jbd2/mmcblk0p4--114   [000]  1876.827745: kmalloc:              call_site=c076dc54 ptr=0xd6d77000 bytes_req=2048 bytes_alloc=2048 gfp_flags=GFP_NOWAIT|__GFP_NOWARN|__GFP_NORETRY|__GFP_NOMEMALLOC
Show latency format -l option for report command can show latency format:
rpi3:/data # trace-cmd record -e sched
rpi3:/data # trace-cmd report -l
cpus=4
trace-cm-1394    1d..3  2535.384180: sched_waking:         comm=kworker/u8:2 pid=1333 prio=120 target_cpu=000
trace-cm-1394    1d..3  2535.384196: sched_migrate_task:   comm=kworker/u8:2 pid=1333 prio=120 orig_cpu=0 dest_cpu=1
trace-cm-1394    1dN.4  2535.384211: sched_wakeup:         comm=kworker/u8:2 pid=1333 prio=120 target_cpu=001
trace-cm-1394    1dNh3  2535.384219: sched_waking:         comm=kworker/1:2 pid=679 prio=120 target_cpu=001
trace-cm-1394    1dNh4  2535.384225: sched_wakeup:         comm=kworker/1:2 pid=679 prio=120 target_cpu=001
trace-cm-1394    1dNh3  2535.384233: sched_waking:         comm=trace-cmd pid=1396 prio=120 target_cpu=000
trace-cm-1394    1dN.2  2535.384244: sched_stat_runtime:   comm=trace-cmd pid=1394 runtime=260938 [ns] vruntime=18863605893 [ns]
  <idle>-0       0dNh2  2535.384251: sched_wakeup:         comm=trace-cmd pid=1396 prio=120 target_cpu=000
trace-cm-1394    1d..2  2535.384253: sched_switch:         prev_comm=trace-cmd prev_pid=1394 prev_prio=120 prev_state=R+ ==> next_comm=kworker/u8:2 next_pid=1333 next_prio=120
Take
trace-cm-1394 1dNh3 2535.384219: sched_waking: comm=kworker/1:2 pid=679 prio=120 target_cpu=001
for example:
1: The first character represents what CPU the trace was recorded on (CPU 1).
d: The 'd' denotes that interrupts were disabled.
N: The "need_resched" flag is set
h: The 'h' means that this was called inside an interrupt handler.
3: kernel lock counter
Recording with filter
trace-cmd report has -l and -n option for function filtering, just like echoing functions to set_ftrace_filter and set_ftrace_notrace:
-l filter function name
-n do not trace function
More than one -l or -n options can be specified on the command line if needed:
rpi3:/data # trace-cmd record -p function -l 'sched_*' -n 'sched_slice'
A list of functions can be used for function filter can be found in file:
/sys/kernel/debug/tracing/available_filter_functions
or by below command:
trace-cmd list -f
Note this only useful with the function and function_graph plugins.
The events can also be filtered. To know what fields can be used for filtering a specific event, look in the format file from /sys/kernel/debug/tracing/events/<subsystem>/<event>/format, or run:
rpi3:/data # trace-cmd report --events |busybox less
on a trace.dat file that was created by the local system. The –events argument will list the event formats of all events that were available in the system that created the tracing file:
system: kmem
name: kmalloc
ID: 185
format:
	field:unsigned short common_type;	offset:0;	size:2;	signed:0;
	field:unsigned char common_flags;	offset:2;	size:1;	signed:0;
	field:unsigned char common_preempt_count;	offset:3;	size:1;	signed:0;
	field:int common_pid;	offset:4;	size:4;	signed:1;

	field:unsigned long call_site;	offset:8;	size:4;	signed:0;
	field:const void * ptr;	offset:12;	size:4;	signed:0;
	field:size_t bytes_req;	offset:16;	size:4;	signed:0;
	field:size_t bytes_alloc;	offset:20;	size:4;	signed:0;
	field:gfp_t gfp_flags;	offset:24;	size:4;	signed:0;
Using the kmalloc event, we can filter on all requests that were greater than 1000 bytes:
rpi3:/data # trace-cmd record -e kmalloc -f 'bytes_req > 1000'
rpi3:/data # trace-cmd report
CPU 3 is empty
cpus=4
        watchdog-713   [002]   127.479896: kmalloc:              call_site=c02d0fec ptr=0xed1d2000 bytes_req=6144 bytes_alloc=8192 gfp_flags=GFP_KERNEL_ACCOUNT|__GFP_NOWARN|__GFP_ZERO
        watchdog-713   [002]   127.479945: kmalloc:              call_site=c0855400 ptr=0xed2e5c00 bytes_req=1020 bytes_alloc=1024 gfp_flags=GFP_KERNEL
    crash_dump32-941   [000]   127.517092: kmalloc:              call_site=c02770bc ptr=0xeb157000 bytes_req=4096 bytes_alloc=4096 gfp_flags=GFP_KERNEL
The -f option specifies a filter for the event (specified in a -e option) preceding it.
Tracing without writing to file
rpi3:/d/tracing # trace-cmd start -p function_graph -g schedule
rpi3:/d/tracing # sleep 5
rpi3:/d/tracing # trace-cmd stop

rpi3:/d/tracing # cat trace
# tracer: function_graph
#
# CPU  DURATION                  FUNCTION CALLS
# |     |   |                     |   |   |   |
 3)               |  schedule() {
 3)   0.729 us    |    preempt_count_add();
 3)               |    rcu_note_context_switch() {
 3)   0.573 us    |      rcu_sched_qs();
 3)   0.625 us    |      rcu_preempt_qs();
 3)   9.270 us    |    }
 3)               |    _raw_spin_lock() {
 3)   0.521 us    |      preempt_count_add();
 3)   4.844 us    |    }
In case of we need the trace file for further investigation, the extract command with -o option can be used:
trace-cmd extract -o trace.dat
Disabling ftrace
To disable all tracing, which will ensure that no overhead is left from using the function tracers or events, the reset command can be used. It will disable all of Ftrace and bring the system back to full performance.
trace-cmd reset
View trace.data with kernelshark
KernelShark is a front end reader of trace-cmd output, here is how it ooks like:
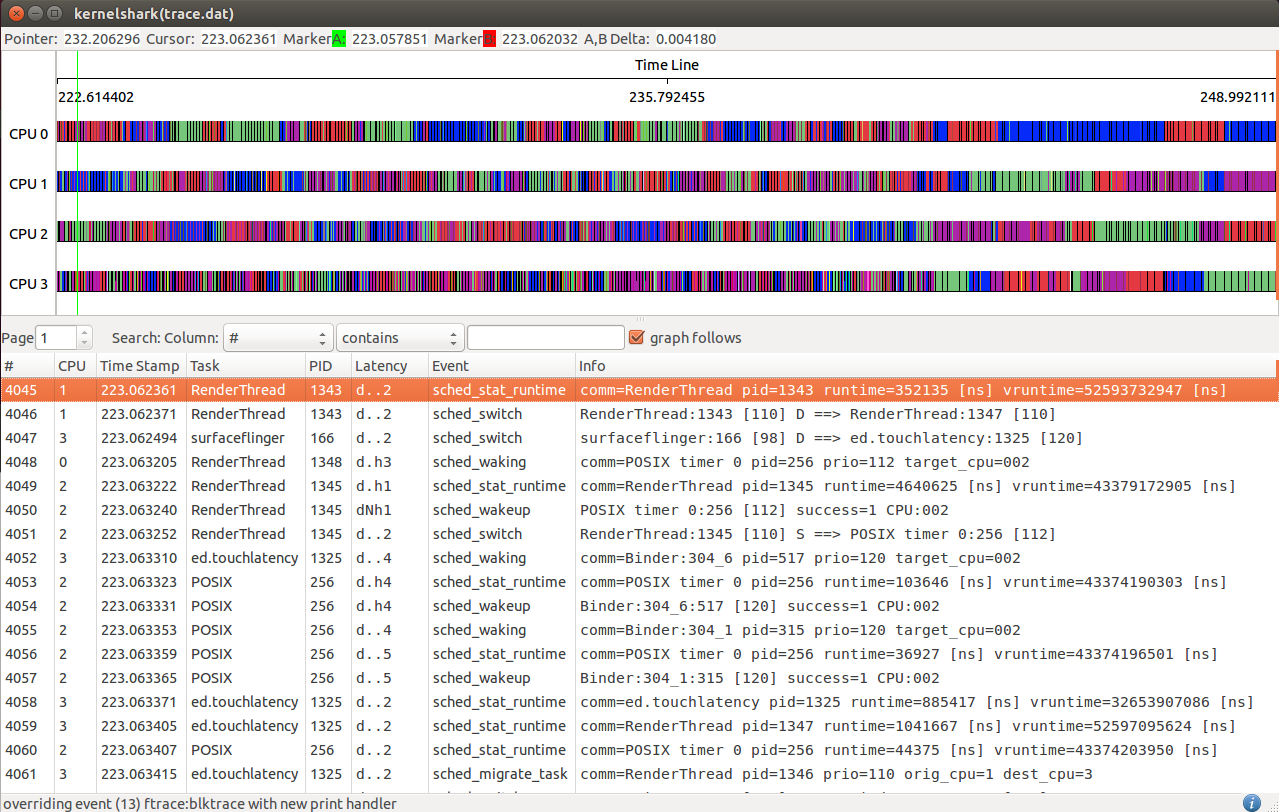
The hollow green bar that is shown in front of some events in the task plot
represents when the task was woken up from a sleeping state to when it actually
ran. The hollow red bar between some events shows that the task was preempted by another
task even though that task was still runnable.
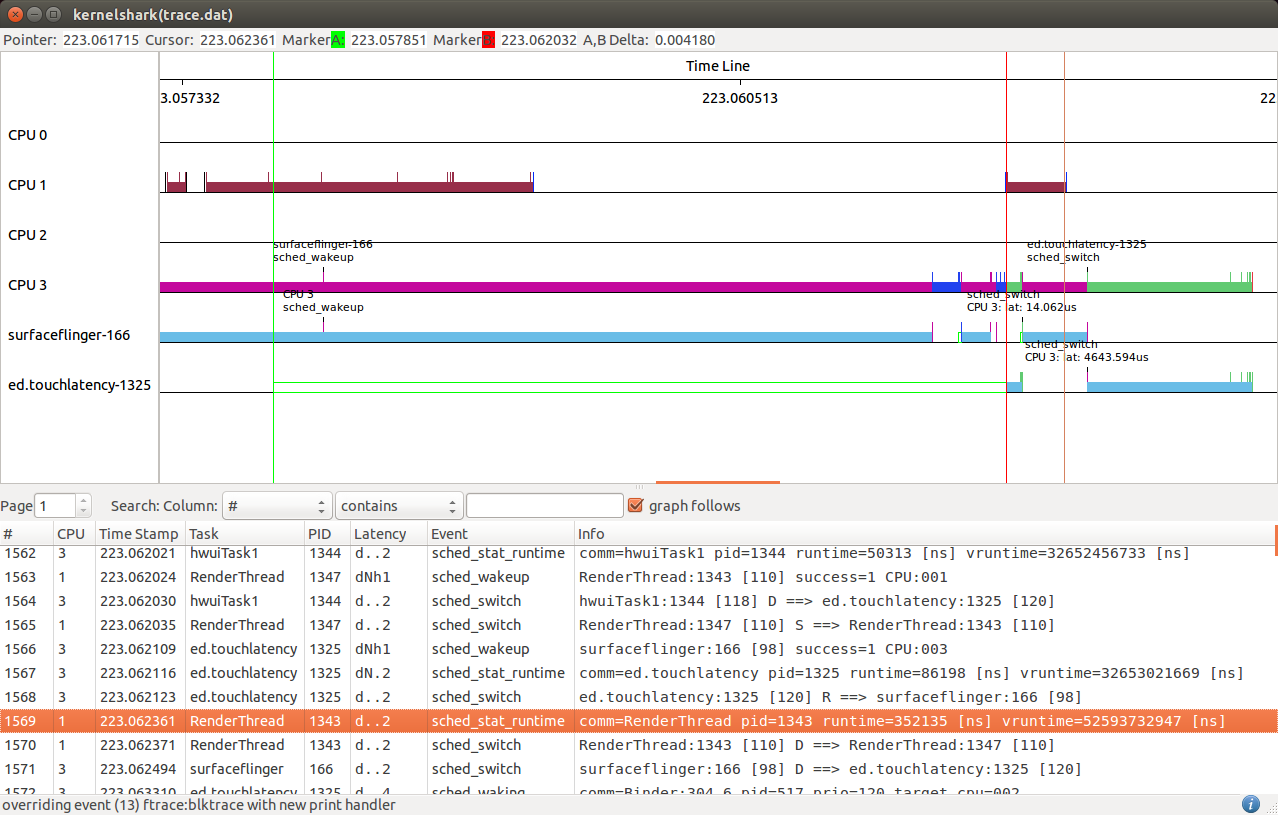
The latency can be measured with A,B markers, the above shows that ed.touchatency with PID 1325 had a 418 microsecond wake up latency. The same can be done with the preemption latency.
Latency - The latency is broken into 5 fields:
- Interrupts disabled - ‘d’ if interrupts are disabled, otherwise ‘.’
- Need reschedule - ‘N’ if the kernel was notified that a schedule is needed, otherwise ‘.’
- In IRQ - ‘h’ if in a hard IRQ (hardware triggered), ‘s’ if in a soft IRQ (context where the kernel initiated a the IRQ handler) or if soft IRQs are disabled, ‘H’ if in a hard IRQ and soft IRQs are disabled or the hard IRQ triggered while processing a soft IRQ, otherwise ‘.’
- Preemption counter - The index of the preemption counter. If it is other than zero, then the kernel will not preempt the running tasks, even if a schedule has been requested by some event. If the counter is zero, then ‘.’ is shown.
- Lock depth - The depth of the big kernel lock being held. The big kernel lock is recursive (same task may acquire it multiple times). On the first acquisition, the depth is zero. This field will be zero or greater, or ‘.’ if the big kernel lock is not held. When the big kernel lock is finally removed from the kernel, this field will go away as well.
KernelShark provides filters for events and tasks via menu, and advanced filter option can be enabled through Filter » advanced events, refer to Advanced Event Filter section of official document.
New features in future version of kernelshark
The author of kernelshark, Steven Rostedt now working for VMware, he made an announcement in VMware’s Open Source Blog that this fall, version 1.0 will be released with the following exciting features:
- Completely rewritten based on Qt
- Improved loading trace file time, the new release(1.0) will be able to load gigabyte file within seconds compared to the GTK version that takes minutes.
- Making KernelShark user modifiable.
- There are no more pop-ups over the mouse; instead, the data is displayed in a constant location at the top. But the interaction is much faster than it was before. Zooming in and out is much smoother and can be done with the use of the mouse wheel.
- Something similar with flamegraphs which show what functions are taking up the most processing time in a CPU.
- Save sessions in JSON format file, that way KernelShark can come back to the exact place where it left off when exited.
- A new capturing feature with no need to run as root.
- Will be able to trace guests along with the host events.
And many more…