
Kernel memory debugging techniques
Linux kernel has many memory related debug tools to help kernel developers find out memory related issues, these tools are included in upstream kernel:
- Kernel Memory Leak Detector
- The Kernel Address Sanitizer (KASAN)
- The Undefined Behavior Sanitizer - UBSAN
- kcov: code coverage for fuzzing
And there are work in progress tools:
kmemleak
kmemleak is a kernel debug option used for detecting kernel memory leaks which
can be found under Kernel hacking ---> Memory Debugging section, enable these
options in order to use this feature:
+CONFIG_DEBUG_INFO=y
+CONFIG_DEBUG_KMEMLEAK=y
+CONFIG_DEBUG_KMEMLEAK_EARLY_LOG_SIZE=2000
+CONFIG_DEBUG_KMEMLEAK_TEST=m
After enabling above configs, build and test new kernel, the following message will be shown in the kernel log:
[    1.099444] kmemleak: Kernel memory leak detector initialized
[    1.099997] kmemleak: Automatic memory scanning thread started
In my system, debugfs was mounted at /sys/kernel/debug by default, if not, mount
it with command:
mount -t debugfs nodev /sys/kernel/debug/
kmemleak was enabled by default, this can be changed by enabling below option:
CONFIG_DEBUG_KMEMLEAK_DEFAULT_OFF
Append kmemleak=on to cmdline(in one line) when you need to enable it.
The default early log buffer size is not big enough for my 64-bit kernel, the kernel disabled kmemleak and report this log if the log buffer exceeds the limit:
[    0.000000] kmemleak: Kernel memory leak detector disabled
[    0.000291] kmemleak: Early log buffer exceeded (1333), please increase DEBUG_KMEMLEAK_EARLY_LOG_SIZE
A kernel thread scans memory for unreferenced objects every 600 seconds, and prints below message if a suspected leak was found:
[ 646.473426] kmemleak: 1 new suspected memory leaks (see /sys/kernel/debug/kmemleak)
Do cat /sys/kernel/debug/kmemleak to see the leak info with stacktrace, and the
report will be similar to this:
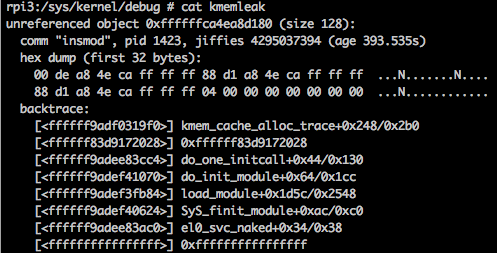
The backtrace information can be decoded with script scripts/decode_stacktrace.sh.
Save the leak report as memleak.txt, the feed it to the script:
cat memleak.txt |./scripts/decode_stacktrace.sh vmlinux . mm/
The script translating offset to line number by using addr2line, make sure enable
CONFIG_DEBUG_INFO option to build kernel with debug info.
Use echo scan > /sys/kernel/debug/kmemleak to trigger memory scan and echo
clear > /sys/kernel/debug/kmemleak to clear current leak info.
KASAN
Kernel Address SANitizer(aka KASAN) is the kernel space address sanitizer, which
can be enabled by config option CONFIG_KASAN, there are two different compiler
instrumentations: CONFIG_KASAN_INLINE and CONFIG_KASAN_OUTLINE, personally I
recommend the former one, because it is 1.1 - 2 times faster, although, it produces
fairly large kernel image(39MB with DEBUG_INFO enabled), which may overlaps ramdisk
image, change ramdisk load address to followkernel to avoid boot issue with newly
built kernel, here is my KASAN configurations:
+CONFIG_DEBUG_INFO=y
+CONFIG_KASAN=y
+CONFIG_KASAN_INLINE=y
+CONFIG_TEST_KASAN=m
KASAN can be disabled on file or directory basis, take a look at mm/Makefile
and mm/kasan/Makefile for example:
# grep KASAN_SANITIZE mm/kasan/Makefile mm/Makefile
KASAN_SANITIZE := n
KASAN_SANITIZE_slab.o := n
With KASAN feature enabled, kernel will print following message at the very first stage, indicates KASAN was initialized:
[ 0.000000] kasan: KernelAddressSanitizer initialized
Linux kernel comes with an example in lib/test_kasan.c showing what kind of
memory bugs can be detected by KASAN, here is part of the report when doing insmod
test_kasan.ko:
[ 2237.155888] kasan test: kmalloc_oob_right out-of-bounds to right
[ 2237.162114] ==================================================================
[ 2237.169513] BUG: KASAN: slab-out-of-bounds in kmalloc_oob_right+0x90/0xc8 [test_kasan]
[ 2237.177567] Write of size 1 at addr ffffffd92cd1077b by task insmod/1472
[ 2237.184379]
[ 2237.185917] CPU: 3 PID: 1472 Comm: insmod Tainted: G    B           4.14.129-v8+ #27
[ 2237.193789] Hardware name: Raspberry Pi 3 Model B Plus Rev 1.3 (DT)
[ 2237.200163] Call trace:
[ 2237.202678] [<ffffffa256e943e0>] dump_backtrace+0x0/0x428
[ 2237.208183] [<ffffffa256e9482c>] show_stack+0x24/0x30
[ 2237.213333] [<ffffffa2584baa9c>] dump_stack+0xac/0xe8
[ 2237.218487] [<ffffffa257284ac0>] print_address_description+0x68/0x278
[ 2237.225043] [<ffffffa257284fd0>] kasan_report+0x228/0x308
[ 2237.230548] [<ffffffa257285220>] __asan_report_store1_noabort+0x30/0x40
[ 2237.237322] [<ffffff9001708420>] kmalloc_oob_right+0x90/0xc8 [test_kasan]
[ 2237.244269] [<ffffff90017096b8>] kmalloc_tests_init+0x18/0x960 [test_kasan]
[ 2237.251363] [<ffffffa256e84d2c>] do_one_initcall+0xac/0x268
[ 2237.257043] [<ffffffa25704675c>] do_init_module+0x198/0x4e4
[ 2237.262719] [<ffffffa25704304c>] load_module+0x534c/0x6ff0
[ 2237.268307] [<ffffffa2570450d0>] SyS_finit_module+0x128/0x140
[ 2237.274155] Exception stack(0xffffffd912dd7ec0 to 0xffffffd912dd8000)
[ 2237.280712] 7ec0: 0000000000000003 00000000b780ac58 0000000000000000 0000000000000000
[ 2237.288680] 7ee0: 0000000000000003 0000000000000000 00000000ffeffc94 000000000000017b
[ 2237.296647] 7f00: 0000000000000000 0000000000000000 0000000000000000 00000000ffeffc8c
[ 2237.304613] 7f20: 00000000ffeffbd8 00000000ffeffbc8 00000000b77cc779 0000000000000000
[ 2237.312580] 7f40: 0000000000000000 0000000000000000 0000000000000000 0000000000000000
[ 2237.320546] 7f60: 0000000000000000 0000000000000000 0000000000000000 0000000000000000
[ 2237.328512] 7f80: 0000000000000000 0000000000000000 0000000000000000 0000000000000000
[ 2237.336479] 7fa0: 0000000000000000 0000000000000000 0000000000000000 0000000000000000
[ 2237.344448] 7fc0: 00000000f1275cdc 0000000060010010 0000000000000003 000000000000017b
[ 2237.352415] 7fe0: 0000000000000000 0000000000000000 0000000000000000 0000000000000000
[ 2237.360383] [<ffffffa256e84a00>] el0_svc_naked+0x34/0x38
[ 2237.365785]
[ 2237.367313] Allocated by task 1472:
[ 2237.370882]  kasan_kmalloc+0xd0/0x180
[ 2237.374620]  kmem_cache_alloc_trace+0x13c/0x2d0
[ 2237.379264]  kmalloc_oob_right+0x50/0xc8 [test_kasan]
[ 2237.384435]  kmalloc_tests_init+0x18/0x960 [test_kasan]
[ 2237.389758]  do_one_initcall+0xac/0x268
[ 2237.393672]  do_init_module+0x198/0x4e4
[ 2237.397583]  load_module+0x534c/0x6ff0
[ 2237.401406]  SyS_finit_module+0x128/0x140
[ 2237.405493]  el0_svc_naked+0x34/0x38
[ 2237.409130]
[ 2237.410654] Freed by task 161:
[ 2237.413775]  kasan_slab_free+0x88/0x198
[ 2237.417687]  kfree+0x84/0x2c8
[ 2237.420723]  binder_delete_free_buffer+0x200/0x598
[ 2237.425606]  binder_free_buf_locked+0x3b4/0x5b0
[ 2237.430224]  binder_alloc_free_buf+0x30/0x48
[ 2237.434578]  binder_thread_write+0xd54/0x2f98
[ 2237.439019]  binder_ioctl+0xc98/0x17b4
[ 2237.442846]  compat_SyS_ioctl+0x178/0x15d8
[ 2237.447022]  el0_svc_naked+0x34/0x38
[ 2237.450659]
[ 2237.452187] The buggy address belongs to the object at ffffffd92cd10700
[ 2237.452187]  which belongs to the cache kmalloc-128 of size 128
[ 2237.464918] The buggy address is located 123 bytes inside of
[ 2237.464918]  128-byte region [ffffffd92cd10700, ffffffd92cd10780)
[ 2237.476847] The buggy address belongs to the page:
[ 2237.481729] page:ffffffbf64b34400 count:1 mapcount:0 mapping:          (null) index:0x0
[ 2237.489882] flags: 0x100(slab)
[ 2237.493006] raw: 0000000000000100 0000000000000000 0000000000000000 0000000180100010
[ 2237.500886] raw: 0000000000000000 0000000400000001 ffffffd931403c00 0000000000000000
[ 2237.508755] page dumped because: kasan: bad access detected
[ 2237.514420]
[ 2237.515941] Memory state around the buggy address:
[ 2237.520821]  ffffffd92cd10600: 00 00 00 00 00 00 00 00 00 00 00 00 00 00 00 00
[ 2237.528168]  ffffffd92cd10680: fc fc fc fc fc fc fc fc fc fc fc fc fc fc fc fc
[ 2237.535515] >ffffffd92cd10700: 00 00 00 00 00 00 00 00 00 00 00 00 00 00 00 03
[ 2237.542858]                                                                 ^
[ 2237.550119]  ffffffd92cd10780: fc fc fc fc fc fc fc fc fc fc fc fc fc fc fc fc
[ 2237.557466]  ffffffd92cd10800: 00 00 00 00 00 00 00 00 00 00 00 00 00 00 00 00
[ 2237.564806] ==================================================================
With DEBUG_INFO enabled, we can translate above report with decode_stacktrace.sh
which show the exact file and line number that cuased the invalid access:
$ cat report.txt | ./scripts/decode_stacktrace.sh vmlinux . lib/
[ 2237.155888] kasan test: kmalloc_oob_right out-of-bounds to right
[ 2237.162114] ==================================================================
[ 2237.169513] BUG: KASAN: slab-out-of-bounds in kmalloc_oob_right (mod_plt_sec/lib/test_kasan.c:44) test_kasan
[ 2237.177567] Write of size 1 at addr ffffffd92cd1077b by task insmod/1472
[ 2237.184379]
[ 2237.185917] CPU: 3 PID: 1472 Comm: insmod Tainted: G    B           4.14.129-v8+ #27
[ 2237.193789] Hardware name: Raspberry Pi 3 Model B Plus Rev 1.3 (DT)
[ 2237.200163] Call trace:
[ 2237.202678] dump_backtrace (/home/fdbai/lineageos/kernel/android_kernel_brcm_rpi3/arch/arm64/kernel/traps.c:146)
[ 2237.208183] show_stack (/home/fdbai/lineageos/kernel/android_kernel_brcm_rpi3/arch/arm64/kernel/traps.c:216)
[ 2237.213333] dump_stack (/home/fdbai/lineageos/kernel/android_kernel_brcm_rpi3/lib/dump_stack.c:55)
[ 2237.218487] print_address_description (/home/fdbai/lineageos/kernel/android_kernel_brcm_rpi3/mm/kasan/report.c:253)
[ 2237.225043] kasan_report (/home/fdbai/lineageos/kernel/android_kernel_brcm_rpi3/mm/kasan/report.c:352 /home/fdbai/lineageos/kernel/android_kernel_brcm_rpi3/mm/kasan/report.c:409)
[ 2237.230548] __asan_report_store1_noabort (/home/fdbai/lineageos/kernel/android_kernel_brcm_rpi3/mm/kasan/report.c:432)
[ 2237.237322] kmalloc_oob_right (mod_plt_sec/lib/test_kasan.c:44) test_kasan
[ 2237.244269] kmalloc_tests_init (mod_plt_sec/lib/test_kasan.c:497) test_kasan
[ 2237.251363] do_one_initcall (/home/fdbai/lineageos/kernel/android_kernel_brcm_rpi3/init/main.c:825)
[ 2237.257043] do_init_module (/home/fdbai/lineageos/kernel/android_kernel_brcm_rpi3/kernel/module.c:3463)
[ 2237.262719] load_module (/home/fdbai/lineageos/kernel/android_kernel_brcm_rpi3/kernel/module.c:3790)
[ 2237.268307] SyS_finit_module (/home/fdbai/lineageos/kernel/android_kernel_brcm_rpi3/kernel/module.c:3889 /home/fdbai/lineageos/kernel/android_kernel_brcm_rpi3/kernel/module.c:3865)
[ 2237.274155] Exception stack(0xffffffd912dd7ec0 to 0xffffffd912dd8000)
[ 2237.280712] 7ec0: 0000000000000003 00000000b780ac58 0000000000000000 0000000000000000
[ 2237.288680] 7ee0: 0000000000000003 0000000000000000 00000000ffeffc94 000000000000017b
[ 2237.296647] 7f00: 0000000000000000 0000000000000000 0000000000000000 00000000ffeffc8c
[ 2237.304613] 7f20: 00000000ffeffbd8 00000000ffeffbc8 00000000b77cc779 0000000000000000
[ 2237.312580] 7f40: 0000000000000000 0000000000000000 0000000000000000 0000000000000000
[ 2237.320546] 7f60: 0000000000000000 0000000000000000 0000000000000000 0000000000000000
[ 2237.328512] 7f80: 0000000000000000 0000000000000000 0000000000000000 0000000000000000
[ 2237.336479] 7fa0: 0000000000000000 0000000000000000 0000000000000000 0000000000000000
[ 2237.344448] 7fc0: 00000000f1275cdc 0000000060010010 0000000000000003 000000000000017b
[ 2237.352415] 7fe0: 0000000000000000 0000000000000000 0000000000000000 0000000000000000
[ 2237.360383] el0_svc_naked (/home/fdbai/lineageos/kernel/android_kernel_brcm_rpi3/arch/arm64/kernel/entry.S:930)
[ 2237.365785]
[ 2237.367313] Allocated by task 1472:
[ 2237.370882] kasan_kmalloc (/home/fdbai/lineageos/kernel/android_kernel_brcm_rpi3/mm/kasan/kasan.c:427 /home/fdbai/lineageos/kernel/android_kernel_brcm_rpi3/mm/kasan/kasan.c:448 /home/fdbai/lineageos/kernel/android_kernel_brcm_rpi3/mm/kasan/kasan.c:459 /home/fdbai/lineageos/kernel/android_kernel_brcm_rpi3/mm/kasan/kasan.c:551)
[ 2237.374620] kmem_cache_alloc_trace (/home/fdbai/lineageos/kernel/android_kernel_brcm_rpi3/mm/slub.c:2752)
[ 2237.379264] kmalloc_oob_right (mod_plt_sec/lib/test_kasan.c:42) test_kasan
[ 2237.384435] kmalloc_tests_init (mod_plt_sec/lib/test_kasan.c:497) test_kasan
UBSan
UBSan is a run-time undefined behavior sanity checker, in the previous post titled
Android native memory debugging, we described how to use UBSan in android
native apps, kernel also support UBSan starting from version 4.4, you can enable
it with CONFIG_UBSAN, CONFIG_UBSAN_SANITIZE_ALL was enabled by default to check
entire kernel, this will generate a extremely large kernel image, it is 107MB with
KASAN and KMEMLEAK both enabled.
Sanity check for individual file or directory is also supported by adding:
UBSAN_SANITIZE := y to Makefile for directory or UBSAN_SANITIZE_main.o := y
for single file.
And if CONFIG_UBSAN_SANITIZE_ALL is enabled, similar method can be used to exclude
file or directory from checking.
Build formerly used ubsan example as module:
 24 static int __init ubsan_test_init(void)
 25 {
 26         int k = 0x7fffffff;
 27         k += 1;
 28         return k;
 29 }
 30
 31 module_init(ubsan_test_init);
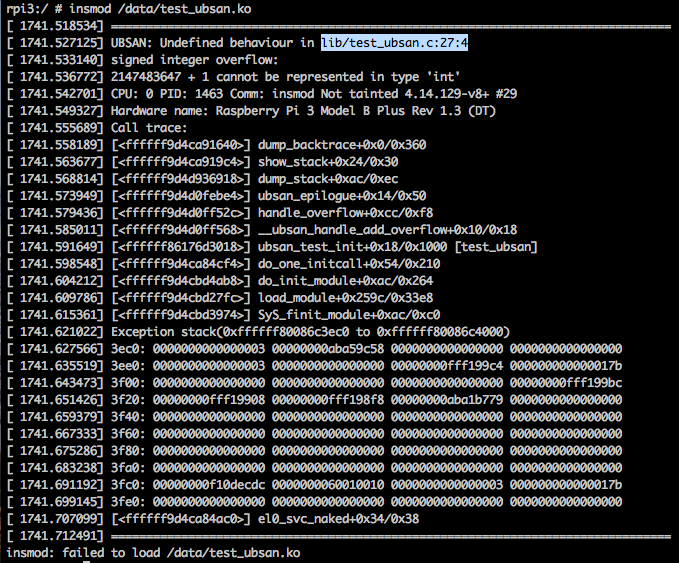
The undefined behavior(signed integer overflow) will be detected and print below
report showing where the problem is when installing this module:
Kernel COVerage (KCOV)
KCOV is kernel code coverage tool and is usually used in coverage-guided fuzzing
test, often used in conjuntion with KASAN, UBSAN etc to do randomized testing to
find kernel memory bugs, to enable it, add CONFIG_KCOV=y to your kernel defconfig,
and by default CONFIG_KCOV_INSTRUMENT_ALL=y is also enabled to do entire kernel
coverage test. Coverage data can be accessed via debugfs file kcov if debugfs
was mounted.
To exclude file or directory from instrumentation, add KCOV_INSTRUMENT directive
like this:
kernel/locking/Makefile:KCOV_INSTRUMENT		:= n
mm/Makefile:KCOV_INSTRUMENT_vmstat.o := n
CONFIG_KCOV requires gcc built on revision 231296 (gcc 6.0+) or later, download
the latest version (as of this writing) for arm64 from linaro’s website.
There is an example in syzkaller showing how to use kcov to collect coverage information in real world.