
Monitoring Android with Prometheus and Grafana
Android operation system is becoming more and more complicated as time goes by, some system issues are hard to diagnostic, and not easy to reproduce, Android is based on kernel, some of the monitoring framework designed for Linux servers could be applied to Android system stats monitoring, give some insights to some of the system issues, I first heard of Prometheus and Grafana from Brendan Gregg’s book BPF Performance Tools, in this post, I’ll show how to monitor Android with Grafana and Prometheus.
The whole system includes a TV box running Armbian with Prometheus and Grafana installed, and an android device to be monitored, in this case, Android TV will be the target, running node exporter to provide system stats which will be pulled by prometheus.
- 192.168.0.20 Armbian
- 192.168.0.4 Android
Prometheus can work with exporters from both official and third-party exporters, you can also write your own exporter or use Prometheus client library in your apps.
Install Node Exporter on Android
Most of the Android devices using arm processors, so compile node_exporter for arm is required:
git clone https://github.com/prometheus/node_exporter.git
env GOOS=linux GOARCH=arm GOARM=7 go build
adb push node_exporter /data/
The result is a statically linked binary which can be run directly on Android:
root@MSD6A838:/ # /data/node_exporter
level=info ts=2021-05-02T13:13:58.256Z caller=node_exporter.go:178 msg="Starting node_exporter" version="(version=, branch=, revision=)"
level=info ts=2021-05-02T13:13:58.258Z caller=node_exporter.go:179 msg="Build context" build_context="(go=go1.14.2, user=, date=)"
level=warn ts=2021-05-02T13:13:58.258Z caller=node_exporter.go:181 msg="Node Exporter is running as root user. This exporter is designed to run as unpriviledged user, root is not required."
level=info ts=2021-05-02T13:13:58.260Z caller=filesystem_common.go:110 collector=filesystem msg="Parsed flag --collector.filesystem.mount-points-exclude" flag=^/(dev|proc|sys|var/lib/docker/.+)($|/)
level=info ts=2021-05-02T13:13:58.261Z caller=filesystem_common.go:112 collector=filesystem msg="Parsed flag --collector.filesystem.fs-types-exclude" flag=^(autofs|binfmt_misc|bpf|cgroup2?|configfs|debugfs|devpts|devtmpfs|fusectl|hugetlbfs|iso9660|mqueue|nsfs|overlay|proc|procfs|pstore|rpc_pipefs|securityfs|selinuxfs|squashfs|sysfs|tracefs)$
level=info ts=2021-05-02T13:13:58.266Z caller=node_exporter.go:106 msg="Enabled collectors"
level=info ts=2021-05-02T13:13:58.267Z caller=node_exporter.go:113 collector=arp
level=info ts=2021-05-02T13:13:58.267Z caller=node_exporter.go:113 collector=bcache
level=info ts=2021-05-02T13:13:58.267Z caller=node_exporter.go:113 collector=bonding
level=info ts=2021-05-02T13:13:58.267Z caller=node_exporter.go:113 collector=btrfs
level=info ts=2021-05-02T13:13:58.267Z caller=node_exporter.go:113 collector=conntrack
level=info ts=2021-05-02T13:13:58.267Z caller=node_exporter.go:113 collector=cpu
level=info ts=2021-05-02T13:13:58.267Z caller=node_exporter.go:113 collector=cpufreq
level=info ts=2021-05-02T13:13:58.267Z caller=node_exporter.go:113 collector=diskstats
[...]
level=info ts=2021-05-02T13:13:58.269Z caller=node_exporter.go:113 collector=vmstat
level=info ts=2021-05-02T13:13:58.269Z caller=node_exporter.go:113 collector=xfs
level=info ts=2021-05-02T13:13:58.269Z caller=node_exporter.go:113 collector=zfs
level=info ts=2021-05-02T13:13:58.270Z caller=node_exporter.go:195 msg="Listening on" address=:9100
level=info ts=2021-05-02T13:13:58.271Z caller=tls_config.go:191 msg="TLS is disabled." http2=false
There are many collectors which are disabled by default such as buddyinfo, processes, zoneinfo etc, you can enable them if needed, e.g.:
/data/node_exporter --collector.processes --collector.interrupts
If some of them need to be enabled, make sure to check the change of scrape_duration_seconds
to ensure that collection is not taking too long.
node exporter expose the metrics to port 9100, which can be retrieved with cURL:
curl http://192.168.0.4:9100/metrics
Prometheus
Prometheus is used to scrape metrics from clients which are called exporters, it can be installed with apt command which will be installed as a systemd service:
sudo apt install -y prometheus
or download from github and run it manually, after installation, the prometheus service should be running:
sudo systemctl status prometheus
● prometheus.service - Monitoring system and time series database
     Loaded: loaded (/lib/systemd/system/prometheus.service; enabled; vendor preset: enabled)
     Active: active (running) since Mon 2021-05-03 01:40:07 UTC; 28s ago
       Docs: https://prometheus.io/docs/introduction/overview/
             man:prometheus(1)
   Main PID: 72797 (prometheus)
      Tasks: 9 (limit: 1725)
     Memory: 26.4M
     CGroup: /system.slice/prometheus.service
             └─72797 /usr/bin/prometheus
We need to configure it to let it retrieve data from node exporter, add below job and restart prometheus:
cat << EOF | sudo tee -a /etc/prometheus/prometheus.yml
        labels:
            group: 'localhost'

      - targets: ['192.168.0.33:9100', '192.168.0.34:9100']
        labels:
            group: 'Linux'

      - targets: ['192.168.0.4:9100']
        labels:
            group: 'Android'
EOF
sudo systemctl restart prometheus
Now you can access prometheus with browser at: http://192.168.0.20:9090
Visualization with Grafana
Grafana supports many Operating System, including Linux, Mac OS and ARM based distributions, download the right package from official website:
sudo apt install -y adduser libfontconfig1
wget -c https://dl.grafana.com/oss/release/grafana_7.5.5_arm64.deb
sudo dpkg -i grafana_7.5.5_arm64.deb

sudo systemctl enable grafana-server
sudo systemctl start grafana-server
We need to setup Grafana for visualizing the metrics exposed by node exporter, go to http://192.168.0.20:3000 to login grafana with admin:admin
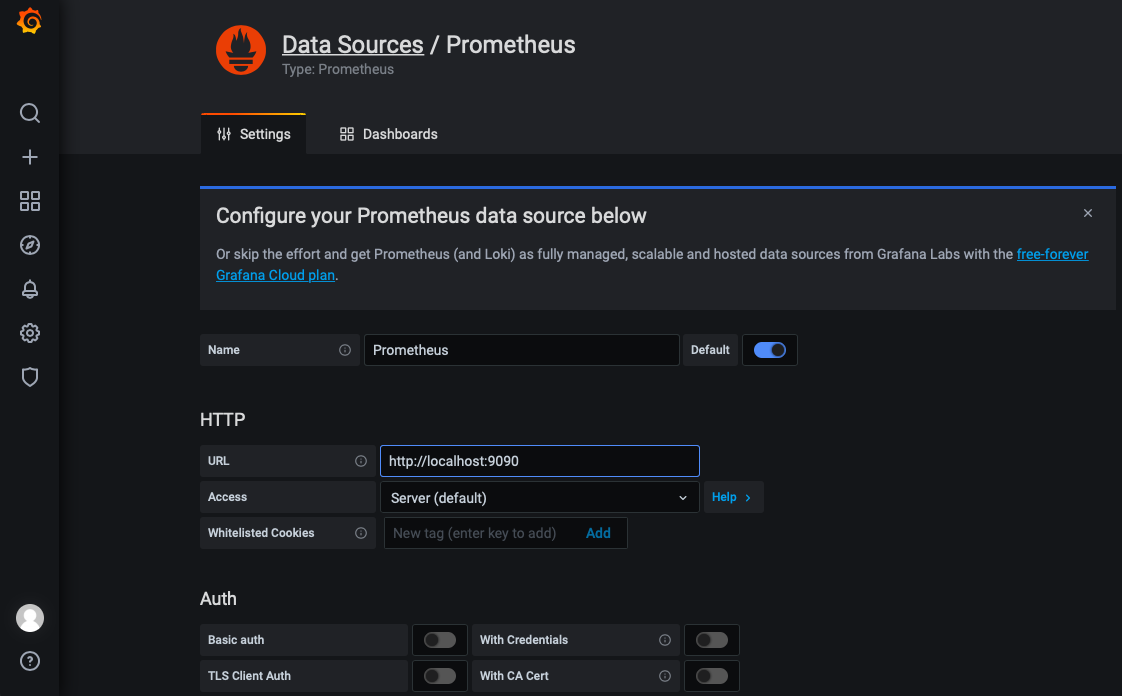
Add Prometheus Data Source
-
Click Settings icon and select Data Sources
-
Click Add Data Source and select Prometheus
-
Enter http://localhost:9090 in the URL text field of HTTP section
-
Click Save & Test button to finish
Create Dashboard
The visualization is actually done by many many dashboards, we will be using Node Exporter Full in this case:
-
Click and select Import
-
Enter 1860 in the textbox under Import via grafana.com
-
Click Load and select Prometheus (default) in the next page
-
Click Import to finish the process.
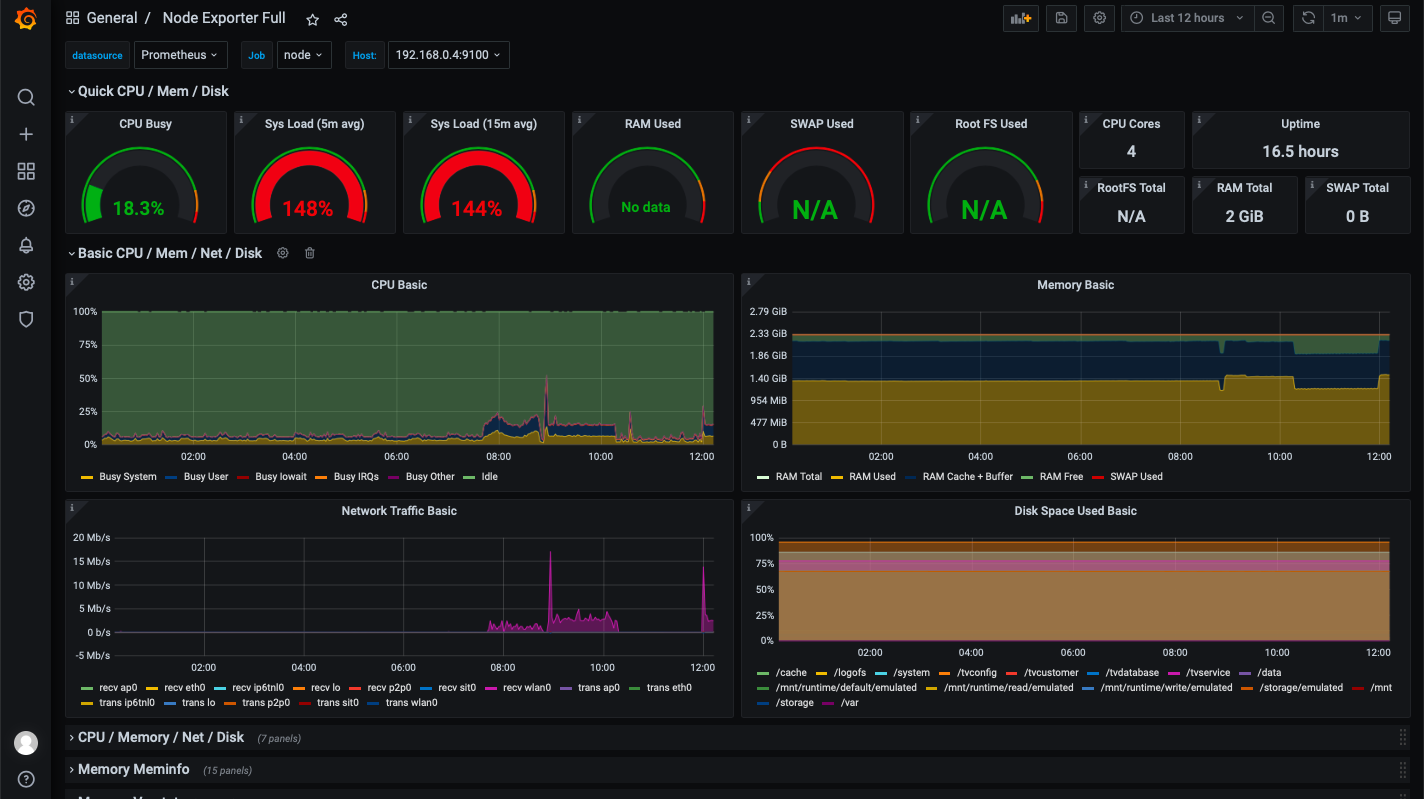
This is a example of node exporter screenshot which running for 12 hours:
Troubleshooting
Prometheus failed to start
I met this issue because I already have prometheus running in background, it was downloaded from github and running manually, kill the background prometheus and restart prometheus service will be OK.
sudo systemctl status prometheus

● prometheus.service - Monitoring system and time series database
   Loaded: loaded (/lib/systemd/system/prometheus.service; enabled; vendor preset: enabled)
   Active: failed (Result: start-limit-hit) since Sun 2021-05-02 16:48:48 CST; 14min ago
     Docs: https://prometheus.io/docs/introduction/overview/
  Process: 12487 ExecStart=/usr/bin/prometheus $ARGS (code=exited, status=0/SUCCESS)
 Main PID: 12487 (code=exited, status=0/SUCCESS)

May 02 16:48:48 fdbai-desktop systemd[1]: prometheus.service: Service hold-off time over, scheduling restart.
May 02 16:48:48 fdbai-desktop systemd[1]: prometheus.service: Scheduled restart job, restart counter is at 5.
May 02 16:48:48 fdbai-desktop systemd[1]: Stopped Monitoring system and time series database.
May 02 16:48:48 fdbai-desktop systemd[1]: prometheus.service: Start request repeated too quickly.
May 02 16:48:48 fdbai-desktop systemd[1]: prometheus.service: Failed with result 'start-limit-hit'.
May 02 16:48:48 fdbai-desktop systemd[1]: Failed to start Monitoring system and time series database.
sudo systemctl status prometheus

● prometheus.service - Monitoring system and time series database
   Loaded: loaded (/lib/systemd/system/prometheus.service; enabled; vendor preset: enabled)
   Active: active (running) since Sun 2021-05-02 17:07:15 CST; 2s ago
     Docs: https://prometheus.io/docs/introduction/overview/
 Main PID: 15848 (prometheus)
    Tasks: 12 (limit: 4915)
   CGroup: /system.slice/prometheus.service
           └─15848 /usr/bin/prometheus
Parsing "Free:": invalid syntax
This issue is vendor specific, Mstar added CMA information to meminfo which breaks the parsing rules, the key info for this issue is Free:
level=error ts=2021-05-02T13:14:07.888Z caller=collector.go:161 msg="collector failed" name=meminfo duration_seconds=0.0116305 err="couldn't get meminfo: invalid value in meminfo: strconv.ParseFloat: parsing \"Free:\": invalid syntax"
The additional information related to above error message is the follow two line:
CMA Free: 88328 kB
CMA heap info(name,alloc,in cache,fail,total free):
 DEFAULT_CMA_BUFFER (352kb 0kb 0kb 16032kb) OTHERS (155648kb 0kb 0kb 0kb) XC0 (122880kb 0kb 0kb 0kb) VDEC0 (0kb 0kb 0kb 49152kb) OTHERS2 (110592kb 0kb 0kb 0kb) RETURN_ENUM6 (0kb 0kb 0kb 36864kb) VDEC1 (133120kb 0kb 0kb 6144kb)
The simplest way to get over this is ignore the last two lines:
diff --git a/collector/meminfo_linux.go b/collector/meminfo_linux.go
index 88505da..799207c 100644
--- a/collector/meminfo_linux.go
+++ b/collector/meminfo_linux.go
@@ -52,6 +52,10 @@ func parseMemInfo(r io.Reader) (map[string]float64, error) {
                if len(parts) == 0 {
                        continue
                }
+               // Workaround for Entries with white space such as Mstar platform
+               if len(parts) >= 4 {
+                       continue
+               }
                fv, err := strconv.ParseFloat(parts[1], 64)