
Android performance profiling tool - simpleperf
Introduction
simpleperf is a native performance profiling tool for Android, like the name indicated, simpleperf is a simplified version of linux-tools-perf with some additional features for Android specific profiling:
-
It collects more info in profiling data, simpleperf not only collects samples in profiling data, but also collects needed symbols, device info and recording time.
-
It delivers new features for recording.
a. When recording dwarf based call graph, simpleperf unwinds the stack before writing a sample to file. This saves storage space on the device.
b. Support tracing both on CPU time and off CPU time with –trace-offcpu option.
c. Support recording callgraphs of JITed and interpreted Java code on Android >= P. -
It relates closely to the Android platform.
a. Is aware of Android environment, like using system properties to enable profiling, using run-as to profile in application’s context.
b. Supports reading symbols and debug information from the .gnu_debugdata section, because system libraries are built with .gnu_debugdata section starting from Android O.
c. Supports profiling shared libraries packaged into apk files.
d. It uses the standard Android stack unwinder, so its results are consistent with all other Android tools. -
It builds executables and shared libraries for different usages.
a. Builds static executables on the device. Since static executables don’t rely on any library, simpleperf executables can be pushed on any Android device and used to record profiling data.
b. Builds executables on different hosts: Linux, Mac, which can be used to report on hosts.
c. Builds report shared libraries on different hosts. The report library is used by different Python scripts to parse profiling data.
It can be used to profile both Android applications and native processes, source code can be found here, it can be used on Android L and above. Currently simpleperf supports the following subcommands:
rpi3:/ # simpleperf
Usage: simpleperf [common options] subcommand [args_for_subcommand]
common options:
    -h/--help     Print this help information.
    --log <severity> Set the minimum severity of logging. Possible severities
                     include verbose, debug, warning, info, error, fatal.
                     Default is info.
    --version     Print version of simpleperf.
subcommands:
    dump                dump perf record file
    help                print help information for simpleperf
    kmem                collect kernel memory allocation information
    list                list available event types
    record              record sampling info in perf.data
    report              report sampling information in perf.data
    report-sample       report raw sample information in perf.data
    stat                gather performance counter information
Host side python scripts
Android NDK provides bunch of python scripts to help simplify the recording and reporting of peformance data on and target device. You may need adb connection to do events recording or pulling binaries from the device.
First things first, install android ndk with below command:
brew cask install android-ndk
simpleperf scripts lies under below directory:
/usr/local/Caskroom/android-ndk/18/android-ndk-r18/simpleperf
These pythons scripts can also be found in Android source tree.
Recording with simpleperf
rpi3:/data # simpleperf record -p 1793 --duration 5
simpleperf I cmd_record.cpp:582] Samples recorded: 20112. Samples lost: 0.
rpi3:/data # ls -l perf.data
-rw-rw-rw- 1 root root 1210725 1970-01-01 02:34 perf.data
rpi3:/data #
Record specific events
simpleperf only record cpu-cycles events by default, use option ‘-e’ specify your intrerested events, available supported events can be found with simpleperf list subcommand.
rpi3:/data # simpleperf record -e task-clock -p 1412 --duration 5
simpleperf I cmd_record.cpp:582] Samples recorded: 20122. Samples lost: 0.
Record with --trace-offcpu
simpleperf is a CPU profiler, it generates samples for a thread only when it is running on a CPU. However, sometimes we want to figure out where the time of a thread is spent, whether it is running on a CPU, or staying in the kernel’s ready queue, or waiting for something like I/O events.
To support this, the record command uses --trace-offcpu to trace both on CPU time and off CPU time. When --trace-offcpu is used, simpleperf generates a sample when a running thread is scheduled out, so we know the callstack of a thread when it is scheduled out. And when reporting a perf.data generated with --trace-offcpu, we use time to the next sample (instead of event counts from the previous sample) as the weight of the current sample. As a result, we can get a call graph based on timestamps, including both on CPU time and off CPU time.
trace-offcpu is implemented using sched:sched_switch tracepoint event, which may not be supported on old kernels. But it is guaranteed to be supported on devices >= Android O MR1. Check with below command:
$ adb shell simpleperf list --show-features
dwarf-based-call-graph
trace-offcpu
set-clockid
$ adb shell simpleperf record -g -p 1412 --duration 10 --trace-offcpu
simpleperf I cmd_record.cpp:582] Samples recorded: 20795 (cut 396). Samples lost: 2.
Record call graphs
simpleperf supports two ways to record the call graph information during a profiling session, namely DWARF-based (record --call-graph dwarf or record -g) and stack frame pointer-based (record --call-graph fp).
Record stack frame based call graph
In general, recording with --call-graph fp is much faster than with --call-graph
dwarf. You should consider using the --call-graph fp option if you are profiling
on devices built on the AArch-64 architecture (arm64-v8a), but not on devices
built on the ARM architecture (armeabi and armeabi-v7a). Because devices built
on the ARM architecture typically do not have stack frame registers to support
reliable stack unwinding with the --call-graph fp option.
$ adb shell simpleperf record --call-graph fp \
--app com.example.simpleperf.simpleperfexamplepurejava --duration 10 \
-o /data/local/tmp/perf.data
Add “--call-graph fp” in -r option if using python script app_profiler.py:
$ python app_profiler.py -p com.example.simpleperf.simpleperfexamplewithnative \
        -r "-e task-clock:u -f 1000 --duration 10 --call-graph fp" \
        -lib path_of_SimpleperfExampleWithNative
Record dwarf based call graph
If you are profiling on devices built on the ARM architecture, consider using
the --call-graph dwarf option. This enables simpleperf to unwind the stack
using the libunwind library. In order to use the --call-graph dwarf option, you
must provide debug information in your native libraries. So do not strip the native
libraries.
$ adb shell simpleperf record -g \
--app com.example.simpleperf.simpleperfexamplepurejava --duration 10 \
-o /data/local/tmp/perf.data
Add “-g” in -r option if using app_profiler.py:
$ python app_profiler.py -p com.example.simpleperf.simpleperfexamplewithnative \
        -r "-e task-clock:u -f 1000 --duration 10 -g" -lib path_of_SimpleperfExampleWithNative
perf report
simpleperf report is used to report based on perf.data generated by simpleperf record command. Report command groups records into different sample entries, sorts sample entries based on how many events each sample entry contains, and prints out each sample entry. By passing options, we can select where to find perf.data and executable binaries used by the monitored program, filter out uninteresting records, and decide how to group records.
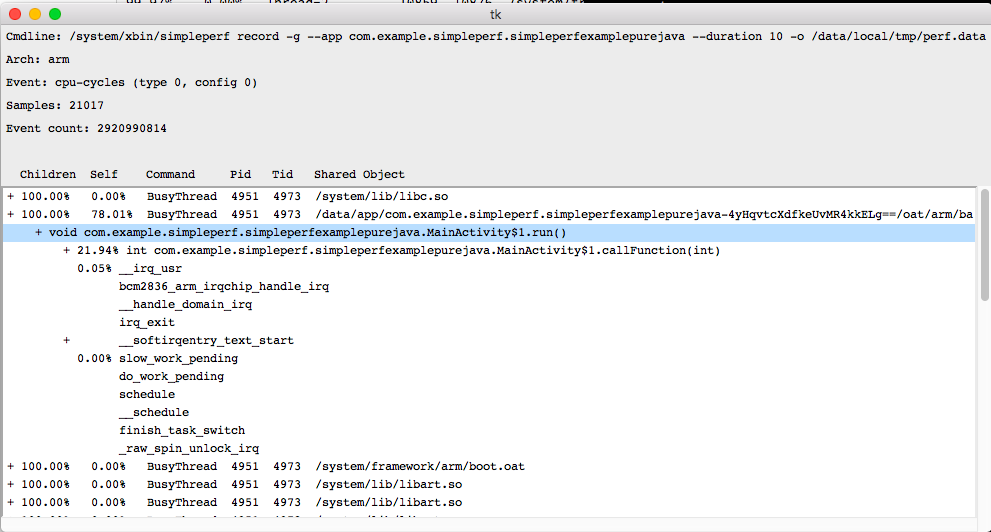
Report call graph
To report call graph using command lines, add -g option.
$ python report.py -g
or
$ ./bin/darwin/x86_64/simpleperf report -g
...
Cmdline: /system/xbin/simpleperf record -g --app com.example.simpleperf.simpleperfexamplepurejava --duration 10 -o /data/local/tmp/perf.data
Arch: arm
Event: cpu-cycles (type 0, config 0)
Samples: 21017
Event count: 2920990814

Children  Self    Command     Pid   Tid   Shared Object                                                                                          Symbol
100.00%   0.00%   BusyThread  4951  4973  /system/lib/libc.so                                                                                    __start_thread
       |
       -- __start_thread
          |
           -- __pthread_start(void*)
              art::Thread::CreateCallback(void*)
              art::InvokeVirtualOrInterfaceWithJValues(art::ScopedObjectAccessAlreadyRunnable const&, _jobject*, _jmethodID*, jvalue*)
              art::InvokeWithArgArray(art::ScopedObjectAccessAlreadyRunnable const&, art::ArtMethod*, art::ArgArray*, art::JValue*, char const*)
              art::ArtMethod::Invoke(art::Thread*, unsigned int*, unsigned int, art::JValue*, char const*)
              art_quick_invoke_stub
              art_quick_invoke_stub_internal
              java.lang.Thread.run
              void com.example.simpleperf.simpleperfexamplepurejava.MainActivity$1.run()
               |--78.01%-- [hit in function]
               |
               |--21.94%-- int com.example.simpleperf.simpleperfexamplepurejava.MainActivity$1.callFunction(int)
               |    |--99.87%-- [hit in function]
...
In addition, python script also support gui mode with –gui option:
$ python report.py -g --gui
# Double-click an item started with '+' to show its callgraph.
Set the path to find executable binaries
If reporting function symbols, simpleperf needs to read executable binaries used by the monitored processes to get symbol table and debug information. By default, the paths are the executable binaries used by monitored processes while recording. However, these binaries may not exist when reporting or not contain symbol table and debug information. So we can use --symfs to redirect the paths.
Filtering records
When reporting, it happens that not all records are of interest. Simpleperf supports four filters to select records of interest.
# Report records in threads having name sudogame.
$ simpleperf report --comms sudogame

# Report records in process 7394 or 7395
$ simpleperf report --pids 7394,7395

# Report records in thread 7394 or 7395.
$ simpleperf report --tids 7394,7395

# Report records in libsudo-game-jni.so.
$ simpleperf report --dsos /data/app/com.example.sudogame-2/lib/arm64/libsudo-game-jni.so
simpleperf stat
simpleperf stat is used to get a raw event counter information of the profiled program or system-wide. By passing options, we can select which events to use, which processes/threads to monitor, how long to monitor and the print interval:
rpi3:/ # simpleperf stat -p 4951 --duration 10
Performance counter statistics:

    5,981,775,450  cpu-cycles            # 0.599927 GHz                     (100%)
    4,315,672,325  instructions          # 1.386059 cycles per instruction  (100%)
      497,935,398  branch-instructions   # 49.939 M/sec                     (100%)
          118,962  branch-misses         # 0.023891% miss rate              (100%)
  9970.844717(ms)  task-clock            # 0.996943 cpus used               (100%)
              386  context-switches      # 38.713 /sec                      (100%)
                0  page-faults           # 0.000 /sec                       (100%)

Total test time: 10.001417 seconds.
Android application profiling
There are three demo app can be used for exmple of application profiling:
SimpleperfExampleOfKotlin
SimpleperfExamplePureJava
SimpleperfExampleWithNative
We will take SimpleperfExamplePureJava as an example to show how to do profiling.
Simpleperf only supports profiling native instructions in binaries in ELF format. If the Java code is executed by interpreter, or with jit cache, it can’t be profiled by simpleperf. As Android supports Ahead-of-time compilation, it can compile Java bytecode into native instructions with debug information. On devices with Android version <= M, we need root privilege to compile Java bytecode with debug information. However, on devices with Android version >= N, we don’t need root privilege to do so.
Build debuggable application
NOTE:
The application should be debuggable for non-rooted devices, it is not required for rooted Android devices.
To profile java code, jvm should be running in oat mode, but on Android O, debuggable applications are forced to run in jit mode. To work around this, we need to add a wrap.sh in the apk. Check here for how to add wrap.sh in the apk.
$ git clone --depth=1 https://android.googlesource.com/platform/system/extras
$ cd extras/simpleperf/demo/SimpleperfExamplePureJava
$ adb install -r app/build/outputs/apk/profiling/app-profiling.apk
Recording with simpleperf command
a. Enable profiling
$ adb shell setprop security.perf_harden 0
b. Compile java bytecode into native instructions
$ adb shell setprop debug.generate-debug-info true
$ adb shell cmd package compile -f -m speed com.example.simpleperf.simpleperfexamplepurejava
c. Record perf data
- Launch app
# Restart the app to take effect $ adb shell am force-stop com.example.simpleperf.simpleperfexamplepurejava $ adb shell am start -n com.example.simpleperf.simpleperfexamplepurejava/.MainActivity - record with PID
$ adb shell pidof com.example.simpleperf.simpleperfexamplepurejava $ adb shell simpleperf record -p 4951 --duration 10 -o /data/perf.data - record with app name
$ adb shell simpleperf record \
--app com.example.simpleperf.simpleperfexamplepurejava --duration 10 \
-o /data/local/tmp/perf.data
d. report perf data
$ pwd
/usr/local/Caskroom/android-ndk/18/android-ndk-r18/simpleperf
$ adb pull /data/perf.data
$ ./bin/darwin/x86_64/simpleperf report
Cmdline: /system/xbin/simpleperf record -p 4951 --duration 10 -o /data/perf.data
Arch: arm
Event: cpu-cycles (type 0, config 0)
Samples: 40187
Event count: 6008070339

Overhead  Command     Pid   Tid   Shared Object                                                                                          Symbol
78.09%    BusyThread  4951  4973  /data/app/com.example.simpleperf.simpleperfexamplepurejava-4yHqvtcXdfkeUvMR4kkELg==/oat/arm/base.odex  void com.example.simpleperf.simpleperfexamplepurejava.MainActivity$1.run()
21.89%    BusyThread  4951  4973  /data/app/com.example.simpleperf.simpleperfexamplepurejava-4yHqvtcXdfkeUvMR4kkELg==/oat/arm/base.odex  int com.example.simpleperf.simpleperfexamplepurejava.MainActivity$1.callFunction(int)
...
Profiling with app-profiler.py
a. perf recording
$ python app_profiler.py --app com.example.simpleperf.simpleperfexamplepurejava \
     -r "-e cpu-cycles:u --duration 10"
If the above command reports: INFO:root:profiling is finished. It will pull perf.data to current directory, and related native binaries in binary_cache/.
b. perf report
$ python report.py
report.py takes same options as simpleper report.
Visualize profiling data
Generate flamegraph with Inferno
Inferno is a tool to generate flamegraph for android programs. It was originally
written to profile surfaceflinger (Android compositor) but it can be used for
other C++ program.
It uses simpleperf to collect data. Programs have to be compiled with frame pointers
which excludes ART based programs for the time being.
Here is how it works:
- Data collection is started via simpleperf and pulled locally as “perf.data”.
- The raw format is parsed, callstacks are merged to form a flamegraph data structure.
- The data structure is used to generate a SVG embedded into an HTML page.
- Javascript is injected to allow flamegraph navigation, search, coloring model.
$ pwd
/usr/local/Caskroom/android-ndk/18/android-ndk-r18/simpleperf
$ ./inferno.sh -sc --symfs binary_cache
Inferno will generate report.html in the current directory and launch web browser automatically to show the flamegraph.
Profiling application with native library
Build and install app
$ git clone --depth=1 https://android.googlesource.com/platform/system/extras
$ cd extras/simpleperf/demo/SimpleperfExampleWithNative
$ adb install -r app/build/outputs/apk/profiling/app-profiling.apk
Recording profile data with app_profiler.py
If there are no symbol table and debug info in native libraries, the profiling result may contain unkown symbols, app_profiler.py script provides -lib option to specify directory that contains unstripped native libraries. Usually the directory can be path of the project(e.g. system-extras/simpleperf/demo/ SimpleperfExampleWithNative)
$ python app_profiler.py -p com.example.simpleperf.simpleperfexamplewithnative \
        --compile_java_code -a .MixActivity \
        -lib system-extras/simpleperf/demo/SimpleperfExampleWithNative
Visualize profiling data
Script report_html.py generates report.html under current directory and open a new tab in browser to show the profiling report results:
$ python report_html.py
$ python report_html.py --add_source_code --add_disassembly \
        --source_dirs system-extras/simpleperf/demo/SimpleperfExampleWithNative
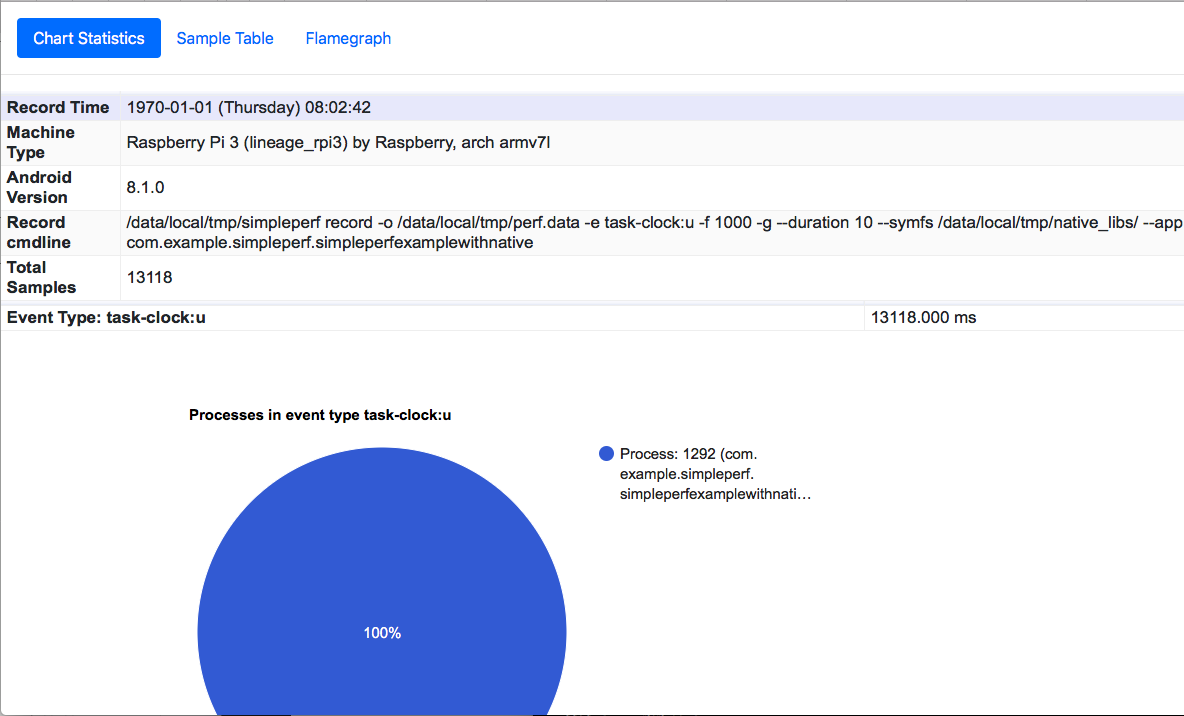
There are several tabs in report.html: The first tab is “Chart Statistics”. You can click the pie chart to show the time consumed by each process, thread, library and function.
The second tab is “Sample Table”. It shows the time taken by each function. By clicking one row in the table, we can jump to a new tab called “Function”.
The third tab is “Flamegraph”. It shows the flame graphs generated by inferno.
The fourth tab is “Function”. It only appears when users click a row in the “Sample Table” tab. It shows information of a function, including:
- A flame graph showing functions called by that function.
- A flame graph showing functions calling that function.
- Annotated source code of that function. It only appears when there are source code files for that function.
- Annotated disassembly of that function. It only appears when there are binaries containing that function.
Profiling android system
Recording perf data
$ python app_profiler.py -np surfaceflinger -r "-g --duration 10"
$ python app_profiler.py -np surfaceflinger -r "--call-graph fp --duration 10"
Generate perf report
$ python report_html.py
Add source code to perf report
Since Android >= O has symbols for system libraries on device, we don’t need to use unstripped binaries in $ANDROID_PRODUCT_OUT/symbols to report call graphs. However, they are needed to add source code and disassembly (with line numbers) in the report. We can use binary_cache_builder.py to collect unstripped binaries from $ANDROID_PRODUCT_OUT/symbols to binary_cache/.
$ python binary_cache_builder.py -lib $ANDROID_PRODUCT_OUT/symbols
Generate report with source code and assembly
$ python report_html.py --add_source_code --add_disassembly \
		--source_dirs $ANDROID_BUILD_TOP
Disassembling all binaries is slow, so it’s better to add --binary_filter option to only disassemble selected binaries.
$ python report_html.py --add_source_code --source_dirs $ANDROID_BUILD_TOP \
		--add_disassembly --binary_filter surfaceflinger.so
Usage of subcommands
simpleperf list
Hardware events
rpi3:/ # simpleperf list hw
List of hardware events:
  cpu-cycles
  instructions
  cache-references
  cache-misses
  branch-instructions
  branch-misses
  bus-cycles
Software events
rpi3:/ # simpleperf list sw
List of software events:
  cpu-clock
  task-clock
  page-faults
  context-switches
  cpu-migrations
  minor-faults
  major-faults
  alignment-faults
  emulation-faults
hw-cache events
rpi3:/ # simpleperf list cache
List of hw-cache events:
  L1-dcache-loads
  L1-dcache-load-misses
  L1-dcache-stores
  L1-dcache-store-misses
  L1-icache-loads
  L1-icache-load-misses
  LLC-loads
  LLC-load-misses
  LLC-stores
  LLC-store-misses
  dTLB-load-misses
  dTLB-store-misses
  iTLB-load-misses
  iTLB-store-misses
  branch-loads
  branch-load-misses
  branch-stores
  branch-store-misses
raw events
rpi3:/ # simpleperf list raw
List of raw events provided by cpu pmu:
  # Please refer to PMU event numbers listed in ARMv8 manual for details.
  # A possible link is https://developer.arm.com/docs/ddi0487/latest/arm-architecture-reference-manual-armv8-for-armv8-a-architecture-profile.
  raw-l1-icache-refill		# level 1 instruction cache refill
  raw-l1-dcache-refill		# level 1 data cache refill
  raw-l1-dcache		# level 1 data cache access
  raw-l1-dtlb-refill		# level 1 data TLB refill
  raw-load-retired		# load (instruction architecturally executed)
  raw-store-retired		# store (instruction architecturally executed)
  raw-instruction-retired		# instructions (instruction architecturally executed)
  raw-exception-taken		# exception taken
  raw-exception-return		# exception return (instruction architecturally executed)
  raw-pc-write-retired		# software change of the PC (instruction architecturally executed)
  raw-br-immed-retired		# immediate branch (instruction architecturally executed)
  raw-unaligned-ldst-retired		# unaligned load or store (instruction architecturally executed)
  raw-br-mis-pred		# mispredicted or not predicted branch speculatively executed
  raw-cpu-cycles		# cpu cycles
  raw-br-pred		# predictable branch speculatively executed
  raw-mem-access		# data memory access
  raw-l1-icache		# level 1 instruction cache access
  raw-l1-dcache-wb		# level 1 data cache write-back
  raw-l2-dcache		# level 2 data cache access
  raw-l2-dcache-refill		# level 2 data cache refill
  raw-l2-dcache-wb		# level 2 data cache write-back
  raw-bus-access		# bus access
  raw-bus-cycles		# bus cycle
tracepoint events
rpi3:/ # simpleperf list tracepoint
List of tracepoint events:
  alarmtimer:alarmtimer_cancel
  alarmtimer:alarmtimer_fired
  alarmtimer:alarmtimer_start
  alarmtimer:alarmtimer_suspend
  asoc:snd_soc_bias_level_done
  asoc:snd_soc_bias_level_start
  asoc:snd_soc_dapm_connected
  asoc:snd_soc_dapm_done
  asoc:snd_soc_dapm_path
  asoc:snd_soc_dapm_start
  asoc:snd_soc_dapm_walk_done
  asoc:snd_soc_dapm_widget_event_done
  asoc:snd_soc_dapm_widget_event_start
  asoc:snd_soc_dapm_widget_power
  asoc:snd_soc_jack_irq
  asoc:snd_soc_jack_notify
  asoc:snd_soc_jack_report
  binder:binder_alloc_lru_end
  binder:binder_alloc_lru_start
  binder:binder_alloc_page_end
  [...]
  writeback:writeback_write_inode
  writeback:writeback_write_inode_start
  writeback:writeback_written
  xdp:xdp_exception
  xdp:xdp_redirect
  xdp:xdp_redirect_err
  xdp:xdp_redirect_map
  xdp:xdp_redirect_map_err
simpleperf record
rpi3:/data # simpleperf record --help
Usage: simpleperf record [options] [--] [command [command-args]]
       Gather sampling information of running [command]. And -a/-p/-t option
       can be used to change target of sampling information.
       The default options are: -e cpu-cycles -f 4000 -o perf.data.
Select monitored threads:
-a     System-wide collection.
--app package_name    Profile the process of an Android application.
                      On non-rooted devices, the app must be debuggable,
                      because we use run-as to switch to the app's context.
-p pid1,pid2,...       Record events on existing processes. Mutually exclusive
                       with -a.
-t tid1,tid2,... Record events on existing threads. Mutually exclusive with -a.

Select monitored event types:
-e event1[:modifier1],event2[:modifier2],...
             Select a list of events to record. An event can be:
               1) an event name listed in `simpleperf list`;
               2) a raw PMU event in rN format. N is a hex number.
                  For example, r1b selects event number 0x1b.
             Modifiers can be added to define how the event should be
             monitored. Possible modifiers are:
                u - monitor user space events only
                k - monitor kernel space events only
--group event1[:modifier],event2[:modifier2],...
             Similar to -e option. But events specified in the same --group
             option are monitored as a group, and scheduled in and out at the
             same time.
--trace-offcpu   Generate samples when threads are scheduled off cpu.
                 Similar to "-c 1 -e sched:sched_switch".

Select monitoring options:
-f freq      Set event sample frequency. It means recording at most [freq]
             samples every second. For non-tracepoint events, the default
             option is -f 4000. A -f/-c option affects all event types
             following it until meeting another -f/-c option. For example,
             for "-f 1000 cpu-cycles -c 1 -e sched:sched_switch", cpu-cycles
             has sample freq 1000, sched:sched_switch event has sample period 1.
-c count     Set event sample period. It means recording one sample when
             [count] events happen. For tracepoint events, the default option
             is -c 1.
--call-graph fp | dwarf[,<dump_stack_size>]
             Enable call graph recording. Use frame pointer or dwarf debug
             frame as the method to parse call graph in stack.
             Default is dwarf,65528.
-g           Same as '--call-graph dwarf'.
--clockid clock_id      Generate timestamps of samples using selected clock.
                        Possible values are: realtime, monotonic,
                        monotonic_raw, boottime, perf. Default is perf.
--cpu cpu_item1,cpu_item2,...
             Collect samples only on the selected cpus. cpu_item can be cpu
             number like 1, or cpu range like 0-3.
--duration time_in_sec  Monitor for time_in_sec seconds instead of running
                        [command]. Here time_in_sec may be any positive
                        floating point number.
-j branch_filter1,branch_filter2,...
             Enable taken branch stack sampling. Each sample captures a series
             of consecutive taken branches.
             The following filters are defined:
                any: any type of branch
                any_call: any function call or system call
                any_ret: any function return or system call return
                ind_call: any indirect branch
                u: only when the branch target is at the user level
                k: only when the branch target is in the kernel
             This option requires at least one branch type among any, any_call,
             any_ret, ind_call.
-b           Enable taken branch stack sampling. Same as '-j any'.
-m mmap_pages   Set the size of the buffer used to receiving sample data from
                the kernel. It should be a power of 2. If not set, the max
                possible value <= 1024 will be used.
--no-inherit  Don't record created child threads/processes.
--cpu-percent <percent>  Set the max percent of cpu time used for recording.
                         percent is in range [1-100], default is 25.

Dwarf unwinding options:
--post-unwind=(yes|no) If `--call-graph dwarf` option is used, then the user's
                       stack will be recorded in perf.data and unwound while
                       recording by default. Use --post-unwind=yes to switch
                       to unwind after recording.
--no-unwind   If `--call-graph dwarf` option is used, then the user's stack
              will be unwound by default. Use this option to disable the
              unwinding of the user's stack.
--no-callchain-joiner  If `--call-graph dwarf` option is used, then by default
                       callchain joiner is used to break the 64k stack limit
                       and build more complete call graphs. However, the built
                       call graphs may not be correct in all cases.
--callchain-joiner-min-matching-nodes count
               When callchain joiner is used, set the matched nodes needed to join
               callchains. The count should be >= 1. By default it is 1.

Recording file options:
--no-dump-kernel-symbols  Don't dump kernel symbols in perf.data. By default
                          kernel symbols will be dumped when needed.
--no-dump-symbols       Don't dump symbols in perf.data. By default symbols are
                        dumped in perf.data, to support reporting in another
                        environment.
-o record_file_name    Set record file name, default is perf.data.
--exit-with-parent            Stop recording when the process starting
                              simpleperf dies.
--size-limit SIZE[K|M|G]      Stop recording after SIZE bytes of records.
                              Default is unlimited.
--start_profiling_fd fd_no    After starting profiling, write "STARTED" to
                              <fd_no>, then close <fd_no>.
--symfs <dir>    Look for files with symbols relative to this directory.
                 This option is used to provide files with symbol table and
                 debug information, which are used for unwinding and dumping symbols.
simpleperf report
rpi3:/data # simpleperf report --help
Usage: simpleperf report [options]
The default options are: -i perf.data --sort comm,pid,tid,dso,symbol.
-b    Use the branch-to addresses in sampled take branches instead of the
      instruction addresses. Only valid for perf.data recorded with -b/-j
      option.
--children    Print the overhead accumulated by appearing in the callchain.
--comms comm1,comm2,...   Report only for selected comms.
--dsos dso1,dso2,...      Report only for selected dsos.
--full-callgraph  Print full call graph. Used with -g option. By default,
                  brief call graph is printed.
-g [callee|caller]    Print call graph. If callee mode is used, the graph
                      shows how functions are called from others. Otherwise,
                      the graph shows how functions call others.
                      Default is caller mode.
-i <file>  Specify path of record file, default is perf.data.
--kallsyms <file>     Set the file to read kernel symbols.
--max-stack <frames>  Set max stack frames shown when printing call graph.
-n         Print the sample count for each item.
--no-demangle         Don't demangle symbol names.
--no-show-ip          Don't show vaddr in file for unknown symbols.
-o report_file_name   Set report file name, default is stdout.
--percent-limit <percent>  Set min percentage shown when printing call graph.
--pids pid1,pid2,...  Report only for selected pids.
--raw-period          Report period count instead of period percentage.
--sort key1,key2,...  Select keys used to sort and print the report. The
                      appearance order of keys decides the order of keys used
                      to sort and print the report.
                      Possible keys include:
                        pid             -- process id
                        tid             -- thread id
                        comm            -- thread name (can be changed during
                                           the lifetime of a thread)
                        dso             -- shared library
                        symbol          -- function name in the shared library
                        vaddr_in_file   -- virtual address in the shared
                                           library
                      Keys can only be used with -b option:
                        dso_from        -- shared library branched from
                        dso_to          -- shared library branched to
                        symbol_from     -- name of function branched from
                        symbol_to       -- name of function branched to
                      The default sort keys are:
                        comm,pid,tid,dso,symbol
--symbols symbol1;symbol2;...    Report only for selected symbols.
--symfs <dir>         Look for files with symbols relative to this directory.
--tids tid1,tid2,...  Report only for selected tids.
--vmlinux <file>      Parse kernel symbols from <file>.
simpleperf stat
rpi3:/data # simpleperf stat --help
Usage: simpleperf stat [options] [command [command-args]]
       Gather performance counter information of running [command].
       And -a/-p/-t option can be used to change target of counter information.
-a           Collect system-wide information.
--app package_name    Profile the process of an Android application.
                      On non-rooted devices, the app must be debuggable,
                      because we use run-as to switch to the app's context.
--cpu cpu_item1,cpu_item2,...
                 Collect information only on the selected cpus. cpu_item can
                 be a cpu number like 1, or a cpu range like 0-3.
--csv            Write report in comma separate form.
--duration time_in_sec  Monitor for time_in_sec seconds instead of running
                        [command]. Here time_in_sec may be any positive
                        floating point number.
--interval time_in_ms   Print stat for every time_in_ms milliseconds.
                        Here time_in_ms may be any positive floating point
                        number. Simpleperf prints total values from the
                        starting point. But this can be changed by
                        --interval-only-values.
--interval-only-values  Print numbers of events happened in each interval.
-e event1[:modifier1],event2[:modifier2],...
                 Select a list of events to count. An event can be:
                   1) an event name listed in `simpleperf list`;
                   2) a raw PMU event in rN format. N is a hex number.
                      For example, r1b selects event number 0x1b.
                 Modifiers can be added to define how the event should be
                 monitored. Possible modifiers are:
                   u - monitor user space events only
                   k - monitor kernel space events only
--group event1[:modifier],event2[:modifier2],...
             Similar to -e option. But events specified in the same --group
             option are monitored as a group, and scheduled in and out at the
             same time.
--no-inherit     Don't stat created child threads/processes.
-o output_filename  Write report to output_filename instead of standard output.
-p pid1,pid2,... Stat events on existing processes. Mutually exclusive with -a.
-t tid1,tid2,... Stat events on existing threads. Mutually exclusive with -a.
--verbose        Show result in verbose mode.