
Android native memory debugging
malloc_debug
malloc debug is a method for debugging android native memory issues, it can detects following three types of memory problems:
- memory corruption
- memory leak
- use after free
Please be noted that before Android 4.4 (API level 19), this feature may not fully functional, using it with modern version is recommended, this post is based on Android O (8.1.0).
By using this feature, these memory related calls are wrapped by adding a shim layer:
- malloc
- free
- calloc
- realloc
- posix_memalign
- memalign
- aligned_alloc
- malloc_usable_size
On 32 bit systems, these two functions which are deprecated, are also replaced:
- pvalloc
- valloc
The detected memory problems will be reported in logcat with tag malloc_debug,
check this out with:
logcat -s libc malloc_debug
How to use malloc_debug
There are many options in malloc_debug, you can use one or more of these options
by setting property libc.debug.malloc.options:
setprop libc.debug.malloc.options "backtrace guards"
By default, malloc debug will track all the processes which use native code, if
you wanna to track only specific program, then libc.debug.malloc.program can
be used, for example we only interest in bootanimation:
setprop libc.debug.malloc.program bootanimation
In case you are tracking programs during system startup, then add these two properties in /vendor/build.prop:
libc.debug.malloc.options=backtrace gurads
libc.debug.malloc.program=bootanimation
Enable backtrace tracking for zygote and zygote based processes by adding below to build.prop file:
libc.debug.malloc.options=backtrace
libc.debug.malloc.program=app_process
By using environment variable, any process spawned from this shell will run with malloc debug enabled:
export LIBC_DEBUG_MALLOC_OPTIONS="backtrace leak_track"
memleak
This method works on Android O and later version.
This is how malloc debug was used for memory problem tracking, now let’s explain its options.
malloc debug options
front_guard[=SIZE_BYTES]
When this option is enabled, a small buffer is placed before the allocated data. This buffer is called front guard, and will be filled with 0xaa on allocation, The guard will be checked when the allocation is freed, if any part of the front guard is modified, an error will be reported in logcat indicating what bytes were changed.
For example, the following code will report front guard issue:
#include <stdio.h>
#include <stdlib.h>

int main()
{
	int i;
	char *a = malloc(10);

	a[-1] = 0xfe;
	for (i = 0; i < 10; i++)
		a[i] = i;

	free(a);

	return 0;
}
Save above test code to memleak.c, and create Android.bp for building:
cc_binary {
    name: "memleak",
    srcs: ["memleak.c"],
    shared_libs: ["libcutils"],
    cflags: [
        "-Werror",
        "-O0",
    ],
}
Now set properties and run memleak to see what happens:
setprop libc.debug.malloc.options front_guard
setprop libc.debug.malloc.program memleak
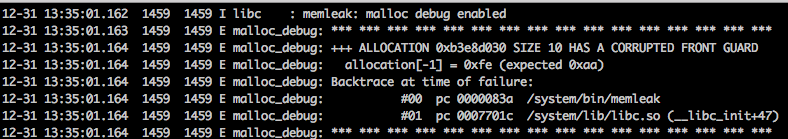 In the above log, the address 0xb3e8d030 indicates the start address of the
allocation.
In the above log, the address 0xb3e8d030 indicates the start address of the
allocation.
By default, the front guard size is 32 bytes, and can be changed with SIZE_BYTES, the max size is 16384. SIZE_BYTES may change if the size you specified is not aligned with 8 bytes on 32 bit systems or 16 bytes on 64 bit systems.
Keep two things in mind:
- Make sure to add
-O0to cflags to force gcc not to optimize our code. - guard check only happends when the allocation is freed, so if you do not call free, the error will not be reported.
rear_guard[=SIZE_BYTES]
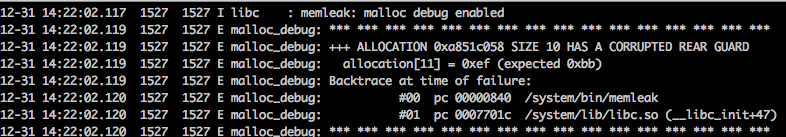
Similar to front guard, rear guard is to place SIZE_BYTES sized buffer after the allocated data, and filled it with 0xbb in this case. When the memory is freed, the guard is checked.
The SIZE_BYTES has the same meaning as front guard.
setprop libc.debug.malloc.options rear_guard
setprop libc.debug.malloc.program memleak
guard[=SIZE_BYTES]
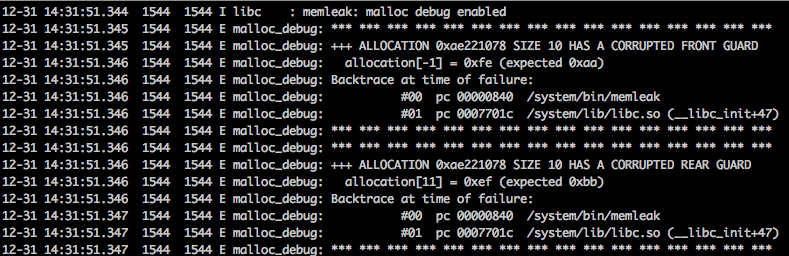
This enables both front guard and rear gaurd on all allocations.
setprop libc.debug.malloc.options guard
setprop libc.debug.malloc.program memleak
backtrace[=MAX_FRAMES]
With backtrace enabled, it will capture the backtrace of each allocation site. This option may slow down allocations by order of magnitude, if tracking system wide allocations, decrease the maximum number of frames by specifying MAX_FRAMES.
The default value of MAX_FRAMES is 16, and the maximum value can be set up to 256.
This option is usually used with other options such as leak_track, for test purpose
we set backtrace frames to 8:
setprop libc.debug.malloc.options "backtrace=8 leak_track"
setprop libc.debug.malloc.program memleak
backtrace_enable_on_signal[=MAX_FRAMES]
fill_on_alloc[=MAX_FILLED_BYTES]
Enabling this option will fill all allocation with value 0xeb, except calloc. When doing realloc to a lager size, the new allocated space will be filled with 0xeb.
The whole allocated memory was filled by default, unless MAX_FILLED_BYTES specified.
fill_on_free[=MAX_FILLED_BYTES]
When an allocation is freed, fill it with 0xef.
Fill Entire allocation unless MAX_FILLED_BYTES specified.
fill[=MAX_FILLED_BYTES]
This enables both fill_on_alloc and fill_on_free.
expand_alloc[=EXPAND_BYTES]
Allocate extra EXPAND_BYTES bytes on allocation, default is 16 bytes, and can be up to 16384 bytes.
free_track[=ALLOCATION_COUNT]
setprop libc.debug.malloc.options leak_track
setprop libc.debug.malloc.program memleak
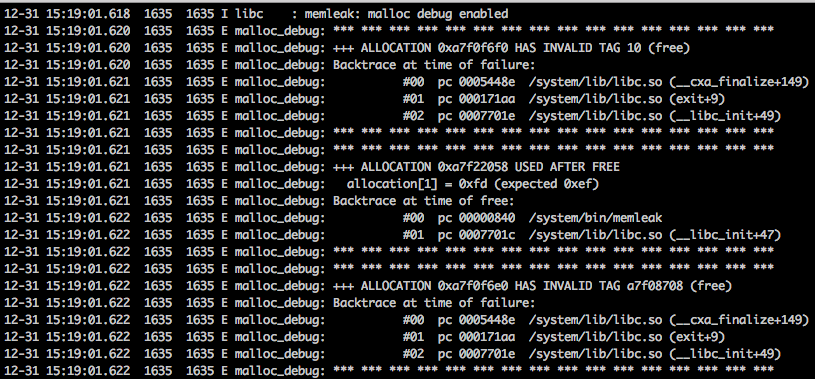
If free_track is enabled, when calling free, the memory is not freed immediately,
instead the pointer was added to a list and the entire allocation was be filled
with 0xef, and the backtrace at the time of free is recorded.
The freed allocation list has a default length of 100 records if ALLOCATION_COUNT was not set, the maximum record is 16384.
Here the backtrace recording is completely separate from the backtrace option, and
will record 16 frames of backtrace by default, this can be changed with option
free_track_backtrace_num_frames which will described in the next section.
Assign value to a freed allocation is detected by malloc_debug:
free_track_backtrace_num_frames[=MAX_FRAMES]
Only makes sense when free_track is enabled, if this value is set to zero, then the backtrace will be disabled completely.
The maximum of backtrace frames to be recorded is 256.
leak_track
setprop libc.debug.malloc.options leak_track
setprop libc.debug.malloc.program memleak
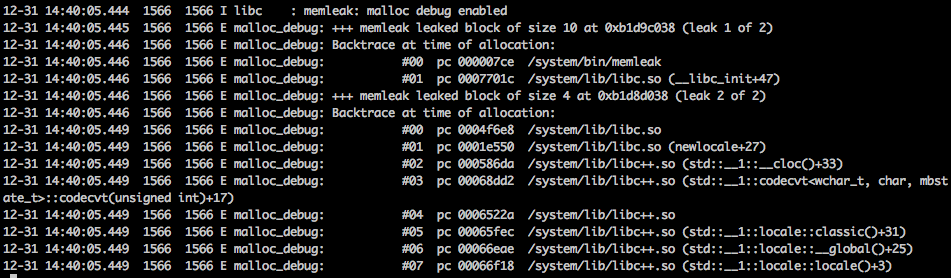
This option enables tracking every allocation, when a program terminated, all
leaked allocation will be dumped to log:

With backtrace enabled, we can track down the exact line where it leaks with the help of addr2line:
setprop libc.debug.malloc.options "backtrace leak_track"
setprop libc.debug.malloc.program memleak
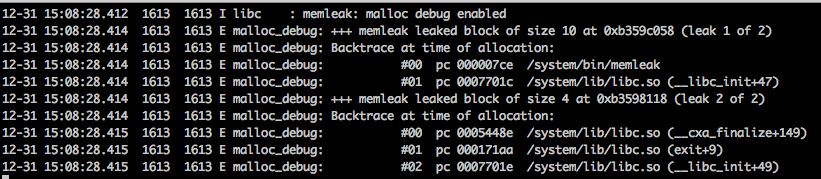
But there is one point I don’t get it: it reports extra 4 bytes leak (the second one), which is incorrect, since there is only one malloc in the test code.
record_allocs[=TOTAL_ENTRIES]
setprop libc.debug.malloc.options record_allocs
setprop libc.debug.malloc.program memleak
Every allocation/free operation made on every thread will be recorded to file
/data/local/tmp/record_allocs.txt when signal 46 (SIGRTMAX - 18) is received,
the file location can be changed with option record_allocs_file.
By default the total number of allocation/free records that dumped to file is 8,000,000, and the maximum value is 50,000,000, which can be set by TOTAL_ENTRIES.
All the records will be cleared upon receving the signal, and new record will be dumped to the file. Any allocations/frees occuring while the data is being dumped to the file are ignored.
This option only exists on Android O and later version.
If this option is set, when program started, following message will be shown in
the log:

Since our test code only include malloc and free operations, so there is only few records in the file, the dumped record will be like this:
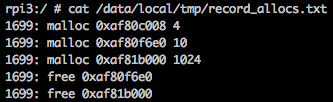
From the above records, it makes sense leak_track reported 4 bytes of leak. But
the question is still there, will find out where the extra two mallocs comes from
later.
Here is the full list of different allocation/free operations with log format and example records:
| call example | log format | example |
|---|---|---|
| THREAD_ID: thread_done 0x0 | 187: thread_done 0x0 | |
| pointer = malloc(size) | THREAD_ID: malloc pointer size | 186: malloc 0xb6038060 20 |
| free(pointer) | THREAD_ID: free pointer | 186: free 0xb6038060 |
| pointer = calloc(nmemb, size) | THREAD_ID: calloc pointer nmemb size | 186: calloc 0xb609f080 32 4 |
| new_pointer = realloc(old_pointer, size) | THREAD_ID: realloc new_pointer old_pointer size | 186: realloc 0xb609f080 0xb603e9a0 12 |
| pointer = memalign(alignment, size) | THREAD_ID: memalign pointer alignment size | |
| posix_memalign(&pointer, alignment, size) | THREAD_ID: memalign pointer alignment size | 186: memalign 0x85423660 16 104 |
| pointer = valloc(size) | THREAD_ID: memalign pointer 4096 size | 186: memalign 0x85423660 4096 112 |
| pointer = pvalloc(size) | THREAD_ID: memalign pointer 4096 SIZE_ROUNDED_UP_TO_4096 | 186: memalign 0x85423660 4096 8192 |
record_allocs_file[=FILE_NAME]
This option only available for Android O and later version, it does not make any sense if record_allocs is disabled.
valgrind
Setup Environment
$ mmm external/valgrind/
$ adb shell mkdir /system/lib/valgrind
$ adb push out/target/product/rpi3/system/lib/valgrind/* system/lib/valgrind/
$ adb push out/target/product/rpi3/system/bin/valgrind /system/bin/
Using valgrind with native app
Here we use the same test app as above with valgrind to detect memory issue, run with:
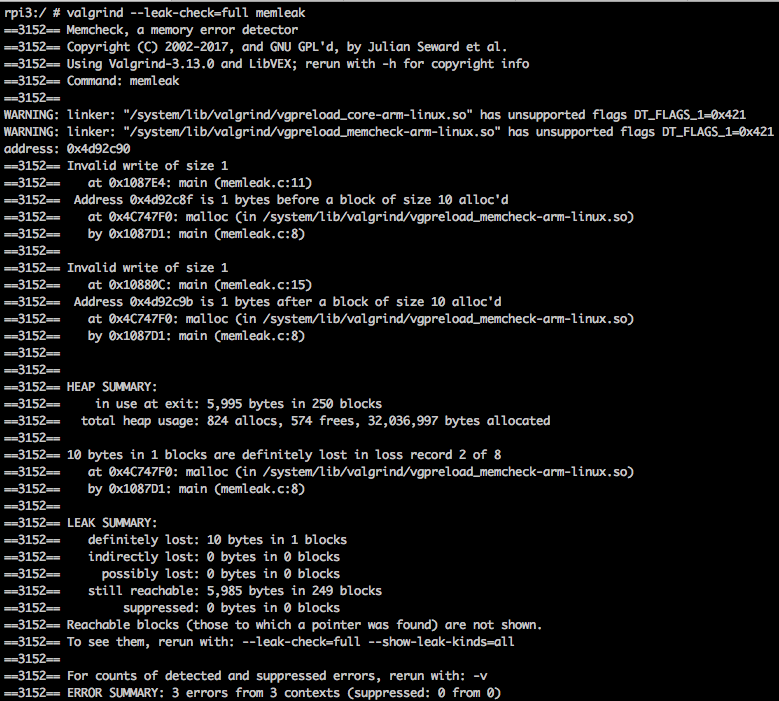
rpi3:/ # valgrind --leak-check=full memleak
All three errors(invalid access, leak) are detected, showing exact line of code
that leads to memory issue:
Using valgrind with system server
setprop wrap.system_server "logwrapper valgrind"
stop && start
Doing this will dump the log to logcat with tag valgrind.
Using valgrind with apk
setprop wrap.com.example.testapp "logwrapper valgrind"
am start -a android.intent.action.MAIN -n com.example.testapp/.MainActivity
How to attach Valgrind to a running process
The faq in Official website says No.
The environment that Valgrind provides for running programs is significantly different to that for normal programs, e.g. due to different layout of memory. Therefore Valgrind has to have full control from the very start.
It is possible to achieve something like this by running your program without any instrumentation (which involves a slow-down of about 5x, less than that of most tools), and then adding instrumentation once you get to a point of interest. Support for this must be provided by the tool, however, and Callgrind is the only tool that currently has such support. See the instructions on the callgrind_control program for details.
Google has deprecated Valgrind, it is recommended to use ASan instead.
AddressSanitizer
ASan is another great tool for android native memory debugging, it can detects:
- Use after free (dangling pointer dereference)
- Heap buffer overflow
- Stack buffer overflow
- Global buffer overflow
- Use after return
- Use after scope
- Initialization order bugs
- Memory leaks (Not available for Android)
- Double free/wild free
Since ASan and Valgrind are very similar, but there are some differences about what kind of memory problems that they can detect, here are some points they defer:
| tools | AddressSanitizer | Valgrind |
|---|---|---|
| technology | compile-time instrumentation | dynamic binary instrumentation |
| slow down | 2x | 20x |
| Heap buffer overflow | yes | yes |
| Stack buffer overflow | yes | no |
| Global buffer overflow | yes | no |
| Use after free (aka dangling pointer) | yes | yes |
| Use after return | yes | no |
| Uninitialized memory reads | no | yes |
| Leaks | yes | yes |
In addition to the above differences, ASan is much faster and less memory overhead.
Sanitizing native app with ASan
In order to use Asan, a rebuild of the app is required by adding sanitize: {
address: true } in Android.bp:
cc_binary {
    name: "memleak",
    srcs: ["memleak.c"],
    shared_libs: ["libcutils"],
    sanitize: {
        address: true,
    },
    cflags: [
        "-Werror",
        "-O0",
    ],
}
or add LOCAL_SANITIZE:=address if using Android.mk.
There is a shared library called libclang_rt.asan-arm-android.so is needed to
run the newly built executable, or it will report file not found issue, so don’t
forget to push it to target system:
$ adb push out/target/product/rpi3/system/lib/libclang_rt.asan-arm-android.so /system/lib/
Now execute test app, to see issues reported by ASan:
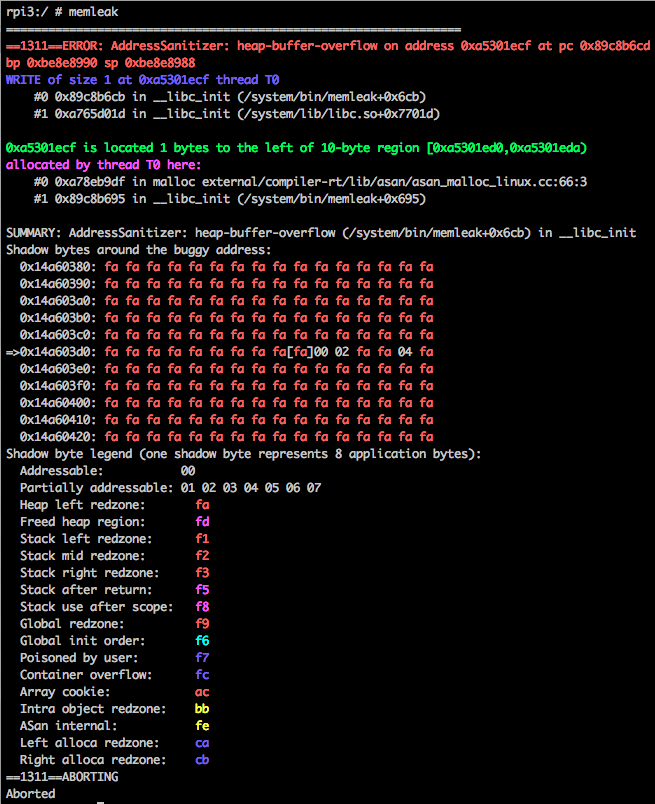
ASan dump detailed report to both standard output and logcat, there is no log tag for this, so be sure not to filter with tags.
ASan will abort the program when error detected..
From the above report we know that, invalid memory access happens at offset 0x6cb
with the help of arm-linux-androideabi-addr2line we can convert the offset to
line number.
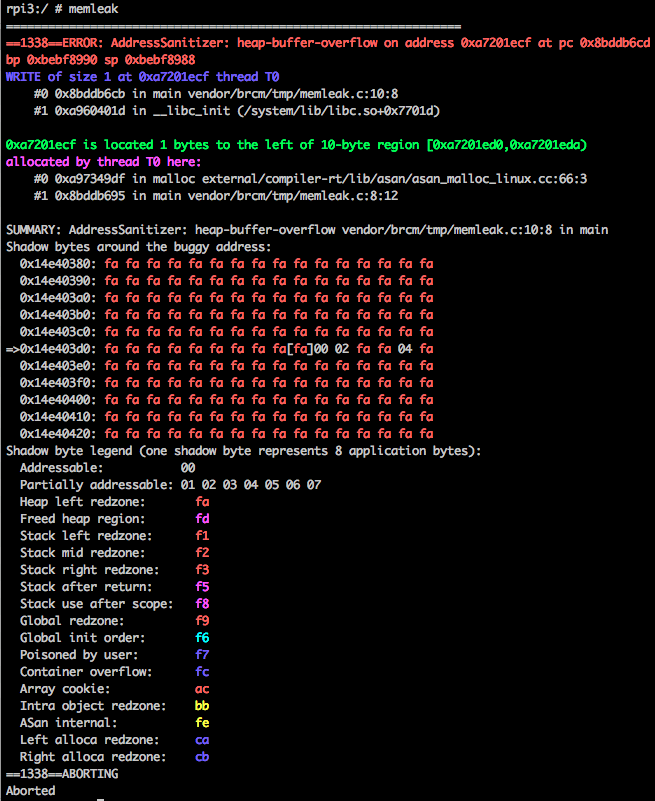
If you are using binary with symbols, and with llvm-symbolizer installed to android
system, it will show line number instead of offset, which is more convenient for
debugging, this is the recommended way to do sanitizing:
The code of llvm-symbolizer can be found in external/llvm/tools/llvm-symbolizer.
There is another option for translating offset to line numbers: symbolize.py,
save the report to file then feed to this python script:
source build/envsetup.sh
lunch lineage_rpi3-userdebug
cat report.txt | external/compiler-rt/lib/asan/scripts/symbolize.py
The output is not that colorful than previous one, but it works though.
Sanitizing shared libraries
Sanitizing shared libraries needs the target executables be also built with ASan
support, here we split formerly used example code to a library named libmem_test:
// cat vendor/brcm/libmem_test/libmem_test.c
#include <stdio.h>
#include <stdlib.h>
#include <unistd.h>

int heap_overflow(void)
{
	char *a = malloc(10);

	a[-1] = 0xfe;
	free(a);

	return 0;
}

int use_after_free(void)
{
	char *a = malloc(10);

	free(a);
	a[1] = 0xfd;

	return 0;
}

int leak_test(void)
{
	char *a = malloc(10);
	a[1] = 0xfd;
	return 0;
}
And the Android.bp to build this library:
// cat vendor/brcm/libmem_test/Android.bp
cc_library_shared {
    name: "libmem_test",
    relative_install_path: "asan",
    srcs: ["libmem_test.c"],
    shared_libs: ["libcutils"],
    sanitize: {
        address: true,
    },
    cflags: [
        "-Werror",
        "-O0",
    ],
}
The library will be installed to out/target/product/rpi3/data/asan/system/lib/asan/.
In case of using Android.mk, the equivalent to do this is:
LOCAL_SANITIZE:=address
LOCAL_MODULE_RELATIVE_PATH := asan
Now, build a executable to test libmem_test, and then push them to target system:
adb shell mkdir -p data/asan/system/lib/asan/
adb push out/target/product/rpi3/symbols/data/asan/system/lib/asan/libmem_test.so data/asan/system/lib/asan/
adb push out/target/product/rpi3/symbols/system/bin/memleak /system/bin/
Since the library we test is not in default /system/lib/, we need to tell where
to find the library by specifying LD_LIBRARY_PATH:
LD_LIBRARY_PATH=/data/asan/system/lib/asan memleak
If you are sanitizing native services, LD_LIBRARY_PATH can be set in init.rc with:
setenv LD_LIBRARY_PATH /data/asan/system/lib/asan
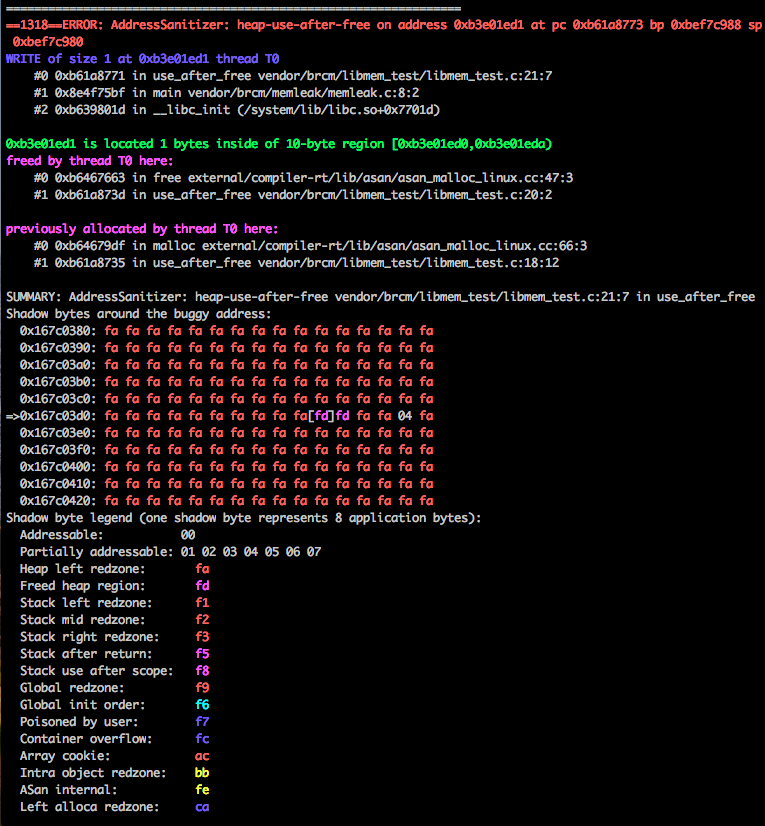
If both the library and the executable are with symbols, the report will be similar
to below output, pointing out where the issue exists in the library, and where it
is called by the executable:
Sanitizing entire Android system
From Android 7.0, sanitizing entire Android system is supported, build with:
make -j16
SANITIZE_TARGET=address make -j16
The second make will generate ASan-instrumented executables and libraries, and
these libraries were installed to data partition at /data/asan/lib/, so reflash
the userdata is required. And all the executables will be replaced with ASan-instrumented
ones.
Note, the android build system will remove all the intermediate object directories
when variable $SANITIZE_TARGET has changed.
There are three types of targets that cannot be built with ASan:
- staticlly linked executables
- LOCAL_CLANG:=false targets
- LOCAL_SANITIZE:=false
Undefined Behavior Sanitizer
UBSan was used for undefined behavior dectection, can be enabled by assigning one
or more supported types to LOCAL_SANITIZE and LOCAL_SANITIZE_DIAG:
LOCAL_SANITIZE := alignment bounds null unreachable integer
LOCAL_SANITIZE_DIAG := alignment bounds null unreachable integer
Only subset of llvm checks are supported by Android system, they are:
- alignment
- bool
- bounds
- enum
- float-cast-overflow
- float-divide-by-zero
- nonnull-attribute
- null
- return
- returns-nonnull-attribute
- shift-base
- shift-exponent
- integer-divide-by-zero
- signed-integer-overflow
- unsigned-integer-overflow
- unreachable
- vla-bound
Here are modules in Android which uses UBSan:
system/extras/verity/Android.mk:LOCAL_SANITIZE := integer
system/extras/verity/fec/Android.mk:LOCAL_SANITIZE := integer
system/extras/libfec/test/Android.mk:LOCAL_SANITIZE := integer
system/security/keystore/Android.mk:LOCAL_SANITIZE := integer
system/core/init/Android.mk:LOCAL_SANITIZE := signed-integer-overflow
system/core/fs_mgr/Android.mk:LOCAL_SANITIZE := integer
system/netd/server/Android.mk:LOCAL_SANITIZE := unsigned-integer-overflow
You can use check groups in llvm, Android also support this feature, but has less
check types, for example, the above integer enables integer-divide-by-zero,
signed-integer-overflow and unsigned-integer-overflow.
Another check group android supported is called default-ub, this group can only
be used with SANITIZE_TARGET, which enables:
- bool
- integer-divide-by-zero
- return
- returns-nonnull-attribute
- shift-exponent
- unreachable
- vla-bound
which is defined in build/core/clang/config.mk, and following can be enabled if compiler performance is not the key point we care about, by uncommenting the below:
# CLANG_DEFAULT_UB_CHECKS += alignment
# CLANG_DEFAULT_UB_CHECKS += bounds
# CLANG_DEFAULT_UB_CHECKS += enum
# CLANG_DEFAULT_UB_CHECKS += float-cast-overflow
# CLANG_DEFAULT_UB_CHECKS += float-divide-by-zero
# CLANG_DEFAULT_UB_CHECKS += nonnull-attribute
# CLANG_DEFAULT_UB_CHECKS += null
# CLANG_DEFAULT_UB_CHECKS += shift-base
# CLANG_DEFAULT_UB_CHECKS += signed-integer-overflow
Bound Sanitizer
BoundSan is used to sanitizing array access, namely out of bound checking.
Enabling Bound Sanitizer
Like UBSan, BoundSan can be enabled for both Android.bp and Android.mk files by
adding bounds to misc_undefined and LOCAL_SANITIZE respectively:
For Android.bp
cc_binary {
    name: "bounds",
    srcs: [
        "bounds.c"
    ],
    sanitize: {
        misc_undefined: ["bounds"],
        diag: {
            misc_undefined: ["bounds"],
        },
    },
}
For Android.mk
LOCAL_SANITIZE := bounds
LOCAL_SANITIZE_DIAG := bounds
diag enables diagnostic mode, in this mode BoundSan does not abort program, it
is optional and can only be used for debug purpose, as it brings high performance
overhead.
Take the follow code for example:
int main()
{
	int a[10];

	a[10] = 0x15;

	return 0;
}
Enabling diagnostics mode will dump a runtime error when an out of bound issue
occurs:
vendor/brcm/rpi3/gist/bounds.c:8:5: runtime error: index 10 out of bounds for type 'int [10]'
Otherwise a tombstone is generated:
08-03 17:50:08.617  3060  3060 F libc    : Fatal signal 6 (SIGABRT), code -6 (SI_TKILL) in tid 3060 (bounds), pid 3060 (bounds)
08-03 17:50:08.674  3063  3063 I crash_dump32: obtaining output fd from tombstoned, type: kDebuggerdTombstone
08-03 17:50:08.675   200   200 I /system/bin/tombstoned: received crash request for pid 3060
08-03 17:50:08.676  3063  3063 I crash_dump32: performing dump of process 3060 (target tid = 3060)
08-03 17:50:08.679  3063  3063 F DEBUG   : *** *** *** *** *** *** *** *** *** *** *** *** *** *** *** ***
08-03 17:50:08.679  3063  3063 F DEBUG   : LineageOS Version: '16.0-20200803-UNOFFICIAL-rpi3'
08-03 17:50:08.680  3063  3063 F DEBUG   : Build fingerprint[63631.967129] init: Untracked pid 3063 exited with status 0
: 'Raspberry/lineage_rpi3/rpi3:9/PQ3A.190801.002/fdbai08031438:userdebug/test-keys'
08-03 17:50:08.680  3063  3063 F DEBUG   : Revision: '0'
08-03 17:50:08.680  3063  3063 F DEBUG   : ABI: 'arm'
08-03 17:50:08.680  3063  3063 F DEBUG   : pid: 3060, tid: 3060, name: bounds  >>> bounds <<<
08-03 17:50:08.680  3063  3063 F DEBUG   : signal 6 (SIGABRT), code -6 (SI_TKILL), fault addr --------
08-03 17:50:08.680  3063  3063 F DEBUG   :     r0  00000000  r1  00000bf4  r2  00000006  r3  00000008
08-03 17:50:08.680  3063  3063 F DEBUG   :     r4  00000bf4  r5  00000bf4  r6  ffcdc25c  r7  0000010c
08-03 17:50:08.681  3063  3063 F DEBUG   :     r8  00000000  r9  00000000  r10 00000000  r11 00000000
08-03 17:50:08.681  3063  3063 F DEBUG   :     ip  ffcdc2bc  sp  ffcdc248  lr  e82aded9  pc  e82a5d2a
08-03 17:50:08.687  3063  3063 F DEBUG   :
08-03 17:50:08.687  3063  3063 F DEBUG   : backtrace:
08-03 17:50:08.687  3063  3063 F DEBUG   :     #00 pc 0001cd2a  /system/lib/libc.so (abort+58)
08-03 17:50:08.688  3063  3063 F DEBUG   :     #01 pc 00000663  /vendor/bin/bounds (main+2)
08-03 17:50:08.688  3063  3063 F DEBUG   :     #02 pc 00088bc1  /system/lib/libc.so (__libc_init+48)
08-03 17:50:08.688  3063  3063 F DEBUG   :     #03 pc 0000061f  /vendor/bin/bounds (_start_main+38)
08-03 17:50:08.688  3063  3063 F DEBUG   :     #04 pc 00000306  <anonymous:e85b7000>
Please be noted that, compiler also checks the array access by option -Warray-bounds
and will generate warning on invalid access:
vendor/brcm/rpi3/gist/bounds.c:8:5: warning: array index 10 is past the end of the array (which contains 10 elements) [-Warray-bounds]
    a[10] = 0x15;
    ^ ~~
vendor/brcm/rpi3/gist/bounds.c:6:5: note: array 'a' declared here
    int a[10];
    ^
It is always a good habit to NOT ignore any of the warnings, they comes with a reason.
Disabling Bound Sanitizer
Functions or source files can be disabled from sanitizing with the help of function attributes or blacklist option, e.g. you can disable BoundSan for a function by adding below before the function:
#if defined(__clang__)
__attribute__((no_sanitize("bounds")))
#endif
or put these two lines to Android.bp and Android.mk respectively:
# For Android.bp
blacklist: "modulename_blacklist.txt",
# For Android.mk
LOCAL_SANITIZE_BLACKLIST := modulename_blacklist.txt
The file name does not matter, you can use other names.
This is a list of examples stolen from Sanitizer special case list in Clang 12 documentation:
# Lines starting with # are ignored.
# Turn off checks for the source file (use absolute path or path relative
# to the current working directory):
src:/path/to/source/file.c
# Turn off checks for a particular functions (use mangled names):
fun:MyFooBar
fun:_Z8MyFooBarv
# Extended regular expressions are supported:
fun:bad_(foo|bar)
src:bad_source[1-9].c
# Shell like usage of * is supported (* is treated as .*):
src:bad/sources/*
fun:*BadFunction*
# Specific sanitizer tools may introduce categories.
src:/special/path/*=special_sources
# Sections can be used to limit blacklist entries to specific sanitizers
[address]
fun:*BadASanFunc*
# Section names are regular expressions
[cfi-vcall|cfi-icall]
fun:*BadCfiCall
# Entries without sections are placed into [*] and apply to all sanitizers
Integer Overflow Sanitizer
Enabling and disabling IntSan are similar with BoundSan.
For static binaries and libraries, individual sanitizers must be specified as
integer_overflow does not support them:
   sanitize: {
      misc_undefined: ["signed-integer-overflow", "unsigned-integer-overflow"],
      diag: {
          misc_undefined: ["signed-integer-overflow",
                           "unsigned-integer-overflow",],
      },
      blacklist: "modulename_blacklist.txt",
   },
This example shows a signed-integer-overflow undefined behavior, taken from
llvm:
$ cat test.c
int main(int argc, char **argv)
{
	int k = 0x7fffffff;
	k += argc;
	return 0;
}
Build above example with this Android.mk:
LOCAL_PATH:= $(call my-dir)

include $(CLEAR_VARS)

LOCAL_SRC_FILES:= ubsan.c
LOCAL_MODULE:= ubsan
LOCAL_SANITIZE := signed-integer-overflow
LOCAL_SANITIZE_DIAG := signed-integer-overflow
LOCAL_CLANG := true

include $(BUILD_EXECUTABLE)
or use equivalent Android.bp
cc_binary {
    cflags: [
        "-std=c11",
        "-Wall",
        "-O0",
    ],
    srcs: ["ubsan.c"],
    name: "ubsan",
    sanitize: {
        misc_undefined: [
            "signed-integer-overflow",
        ],
        diag: {
            undefined : true
        },
    },
}
A runtime library called libclang_rt.ubsan_standalone-arm-android.so is required
to run executables when diagnostic mode is enabled with LOCAL_SANITIZE_DIAG in
Android.mk or diag in blueprint file:
adb push out/target/product/rpi3/system/lib/libclang_rt.ubsan_standalone-arm-android.so /system/lib/

This message is also logged into logcat.
There is a series of post in LLVM PROJECT BLOG talking about undefined behavior:
What Every C Programmer Should Know About Undefined Behavior