Analyzing Android Boot Time with Bootchart and Systrace
Introduction
Bootchart is a great tool for performance analysis and visualization of the Linux/Android boot process, it consists of two parts: data collection and host side post processing(rendering) tool, for android platform, data collection part was built into init program, and will collect resource utilization like cpu, I/O and disk utilization.
The initial version of the rendering part was written in java by Ziga Mahkovec and later rewrote in python by Anders Norgaard and Henning Niss hosted on google code named pybootchartgui, now pybootchartgui has been replaced by bootchart2 on github.
How to enable bootchart?
bootchart can be enabled by issue below command in the serial console:
touch /data/bootchart/enabled; reboot
after reboot init process will produce the following files for later analysis:
header
proc_stat.log
proc_ps.log
proc_diskstats.log
To make bootchart2 work best, please ensure your kernel is configured with CONFIG_PROC_EVENTS=y and CONFIG_TASKSTATS=y, without these we are slower, less accurate, and produce an uglier task hierarchy.
Because we only care about the booting process so we stop bootcharting after boot completed in init.rc when property sys.boot_completed was set to 1:
on property:sys.boot_completed=1
Remember delete file /data/bootchart/enabled after boot time performance job get done.
Bootchart Rendering
Android provides a handy script for processing the bootchart output files under system/core/init/ named grab-bootchart.sh. This script need bootchart2 to be installed, install it with apt-get under Ubuntu:
sudo apt-get install bootchart
grab-bootchart.sh with little modification:
TMPDIR=/tmp/android-bootchart
rm -rf $TMPDIR
mkdir -p $TMPDIR

LOGROOT=/data/bootchart
TARBALL=bootchart.tgz

FILES="header proc_stat.log proc_ps.log proc_diskstats.log"

for f in $FILES; do
    adb "${@}" pull $LOGROOT/$f $TMPDIR/$f 2>&1 > /dev/null
done
(cd $TMPDIR && tar -czf $TARBALL $FILES)
bootchart -f svg -o bootchart.svg ${TMPDIR}/${TARBALL}
gnome-open ${TARBALL%.tgz}.svg
echo "Clean up ${TMPDIR}/ and ./${TARBALL%.tgz}.svg when done"
The above script pull output files through adb connection, so do adb connect before executing the script.
Android also comes with another script compare-bootcharts.py that can be used for comparing before and after tuning to see if we have made better or worse:
fdbai@fdbai-desktop:~/github/perf-tools$ ./compare-bootcharts.py /tmp/bootchart1/ /tmp/bootchart2/
process: baseline experiment (delta)
 - Unit is ms (a jiffy is 10 ms on the system)
------------------------------------
/init: 0 0 (+0)
/system/bin/surfaceflinger: 5490 6730 (+1240)
/system/bin/bootanimation: 8520 9700 (+1180)
zygote: 5180 6430 (+1250)
system_server: 18010 21460 (+3450)
bootanimation ends at: 71120 76090 (+4970)
Example bootchart
Here is the bootchart of running lineageos on raspberrypi 3B:
 I know it takes too long to complete booting process, I will make it better, that’s
my job.
I know it takes too long to complete booting process, I will make it better, that’s
my job.
Integrate bootchart with workload-automation
wa is great, use it often.
In this post, I demonstrated how to create a apkuiauto type of wa plugin, this time it is more easier than that, we only need python, create perfboot plugin with wa create workload -k basic perfboot and copy this snippet to __init__.py
    def do_bootchart(self, output_dir):
        host_dir = os.path.join(output_dir, 'bootchart')
        if not os.path.isdir(host_dir):
            os.mkdir(host_dir)

        output_files = "header proc_stat.log proc_ps.log proc_diskstats.log"
        for fname in output_files.split(' '):
            target_file = os.path.join(self.bootchart_dir, fname)
            self.target.pull(target_file, host_dir, as_root=True)

        self.logger.debug('Generating bootchart')
        command = ['bootchart', '-f', 'svg', '-o', output_dir,
                   '--show-pid', host_dir]
        try:
            output = subprocess.check_output(command, stderr=subprocess.STDOUT)
            if sys.version_info[0] == 3:
                output = output.decode(sys.stdout.encoding, 'replace')
        except subprocess.CalledProcessError as e:
            raise HostError('Error generating bootchart {}. \n{}'
                            .format(apk_path, e.output))
Append device_config to default config file: ~/.workload_automation/config.yaml
device_config:
    device: 192.168.1.15:5555
    working_directory: '/data/wa/'
Or specify in agenda config section, see below perfboot.yaml:
config:
    iterations: 10
    execution_order: by_workload
    reboot_policy: each_job
    device: generic_android
    device_config:
        device: 192.168.1.15:5555

workloads:
-   name: launcher
    id: launcher
    workload_params:
        bootchart: True
In this workload, we need to set reboot_policy to each_job, the other allowed values are:
"as_needed"
The device will only be rebooted if the need arises (e.g. if it becomes unresponsive.)
"never"
The device will never be rebooted.
"initial"
The device will be rebooted when the execution first starts, just before executing
the first workload spec.
"each_job"
The device will be rebooted before each new job.
"each_spec"
The device will be rebooted before running a new workload spec.
refer to Run Configuration for more.
Now run wa run perfboot.yaml -vf and wait for workload complete.
I call it perfboot, because this plugin not only generate bootchart but also record boot_progress_xxx event time which is very useful during boot time perf tuning process, perfboot part code was taken from android perfboot.
Full source code of perfboot can be found in github.
Inspect performance issue with systrace
Bootchart only show us the cpu and I/O load breakdown of processes, but analyzing boot up process need more detailed information, using systrace we can get both kernel and android specific traces during boot up.
systrace was disabled by default, to enable systrace during bootup, comment out following line:
write /sys/kernel/debug/tracing/tracing_on 0
in file /system/etc/init/atrace.rc or frameworks/native/cmds/atrace/atrace.rc if you build your own image.
Stop atrace when system boot complete, add these lines to init.rc:
on property:sys.boot_completed=1 (this stops tracing on boot complete)
    write /d/tracing/tracing_on 0
    write /d/tracing/events/ext4/enable 0
    write /d/tracing/events/block/enable 0
Enable trace event in kernel cmdline, add following to cmdline.txt
trace_buf_size=64M trace_event=sched_wakeup,sched_switch,sched_blocked_reason,sched_cpu_hotplug
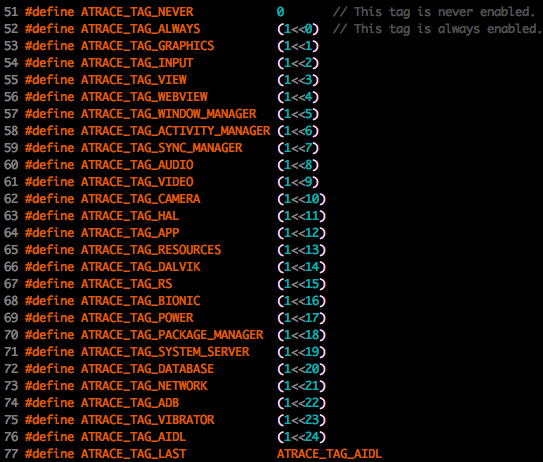
To make boottrace working, set property debug.atrace.tags.enableflags=802922 in default.prop, for rpi this file comes from ramdisk.img, unpacking/packing with:
gzip -cd ramdisk.img | cpio -imd --quiet
find . | cpio --quiet -H newc -o | gzip -9 -n > /tmp/ramdisk.img
or overrides in android mk file:
PRODUCT_PROPERTY_OVERRIDES += debug.atrace.tags.enableflags=802922
According to tags defined in system/core/libcutils/include/cutils/trace.h, 802922 means GRAPHICS, VIEW, WINDOW_MANAGER, ACTIVITY_MANAGER, DALVIK, PACKAGE_MANAGER, SYSTEM_SERVER are traced:
Pull the trace after boot complete with:
adb root && adb shell "cat /d/tracing/trace" > boot_trace
./catapult/tracing/bin/trace2html boot_trace --output boot_trace.html

# for Android 8 and later
adb root && adb shell atrace --async_stop -z -c -o /data/local/tmp/boot_trace
adb pull /data/local/tmp/boot_trace
systrace.py --from-file=boot_trace
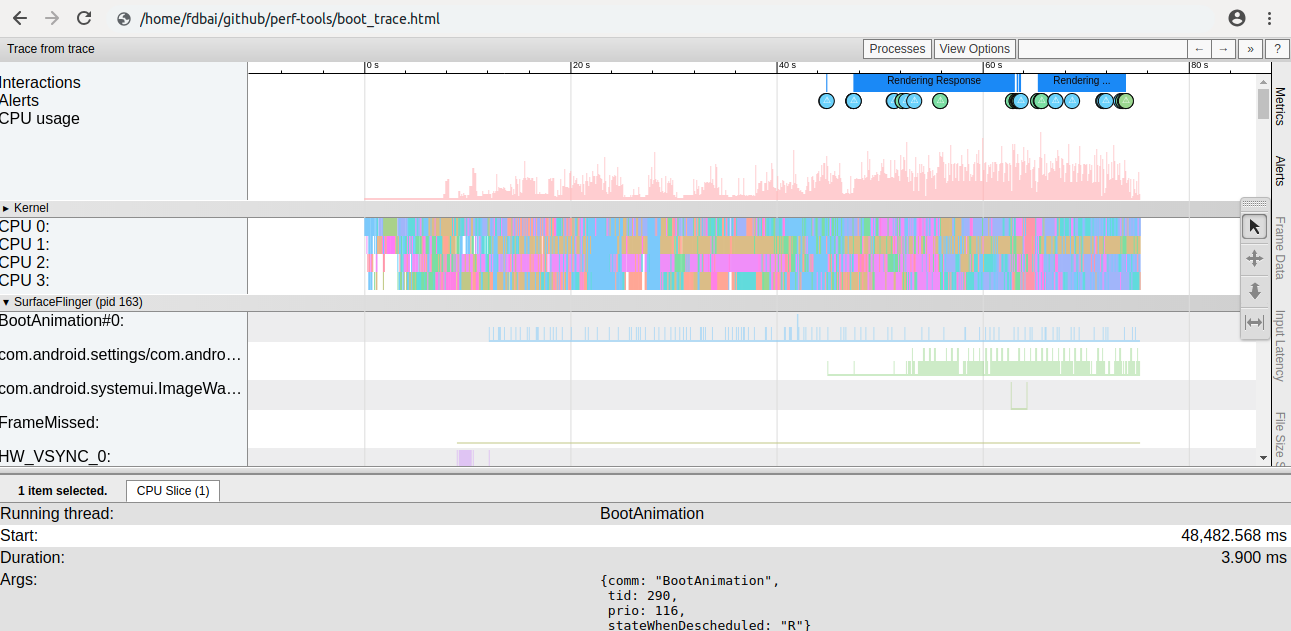
An exapmple boot trace may looks like this:
Boot up process may also involve the I/O analyzing, for this case append block and ext4 to cmdline.txt:
trace_event=block,ext4
To see file access during bootup, apply the following patch to the kernel:
diff --git a/fs/open.c b/fs/open.c
index 1651f35..a808093 100644
--- a/fs/open.c
+++ b/fs/open.c
@@ -981,6 +981,25 @@
 }
 EXPORT_SYMBOL(file_open_root);

+static void _trace_do_sys_open(struct file *filp, int flags, int mode, long fd)
+{
+       char *buf;
+       char *fname;
+
+       buf = kzalloc(PAGE_SIZE, GFP_KERNEL);
+       if (!buf)
+               return;
+       fname = d_path(&filp->f_path, buf, PAGE_SIZE);
+
+       if (IS_ERR(fname))
+               goto out;
+
+       trace_printk("%s: open(\"%s\", %d, %d) fd = %ld, inode = %ld\n",
+                     current->comm, fname, flags, mode, fd, filp->f_inode->i_ino);
+out:
+       kfree(buf);
+}
+
long do_sys_open(int dfd, const char __user *filename, int flags, umode_t mode)
 {
        struct open_flags op;
@@ -1003,6 +1022,7 @@
                } else {
                        fsnotify_open(f);
                        fd_install(fd, f);
+                       _trace_do_sys_open(f, flags, mode, fd);
Check file read
system/extras/boottime_tools/io_analysis/check_file_read.py boot_trace
Provides access information per each file.
/dev/block/mmcblk0p2 992M  561M  431M  57% /system
/dev/block/mmcblk0p3 248M   11M  237M   5% /vendor
/dev/block/mmcblk0p4 2.5G  818M  1.7G  32% /data

*Summary*
Total blocks read 70277
Total blocks wrote 1579
Partition total_reads total_writes num_files
/data/ 7783 1579 617
/system/ 60801 0 903
/vendor/ 1693 0 102
Check IO trace
system/extras/boottime_tools/io_analysis/check_io_trace_all.py boot_trace
output:
total read blocks, 593522
total write blocks, 29584
Total DM R
Total DM W
**Process total R/W
Process, main-142
 total reads, 170536
 total writes, 0
 total dm reads, 0
 total dm writes, 0
 R per device
  179000 170536
 W per device
Process, system_server-303
 total reads, 60632
 total writes, 952
 total dm reads, 0
 total dm writes, 0
 R per device
  179000 60632
 W per device
  179000 952

...

PID: 0  name: swapper/0
 total execution time: 31029.448  io wait: 0.0  other wait: 69320.748
 Core execution: OrderedDict([(0, 8205.6850000002), (1, 7471.2980000001535), (2, 7055.086000000015), (3, 8297.379000000377)])
 Wait calls: OrderedDict()
 IO Wait time per wait calls: OrderedDict()
 Wait time histogram: OrderedDict()
PID: 1  name: init
 total execution time: 1834.254  io wait: 0.0  other wait: 73399.872
 Core execution: OrderedDict([(0, 911.2829999999942), (1, 557.8189999999468), (2, 74.98300000000017), (3, 290.1690000000053)])
 Wait calls: OrderedDict()
 IO Wait time per wait calls: OrderedDict()
...
Troubleshooting
If the systrace you captured contains only 3 seconds data, you should check if the trace buffer size was set correctly.