An introduction to android systrace
what is systrace
The systrace is a host python script shipped with android sdk, it lies under platform-tools directory:
/Users/fdbai/Library/Android/sdk/platform-tools/systrace
It can be used for collect CPU scheduler, disk activity and app threads, it combines these data to generate a report in html format, it is usually used for inspecting timing related issues such as janking. systrace is part of the Catapult project.
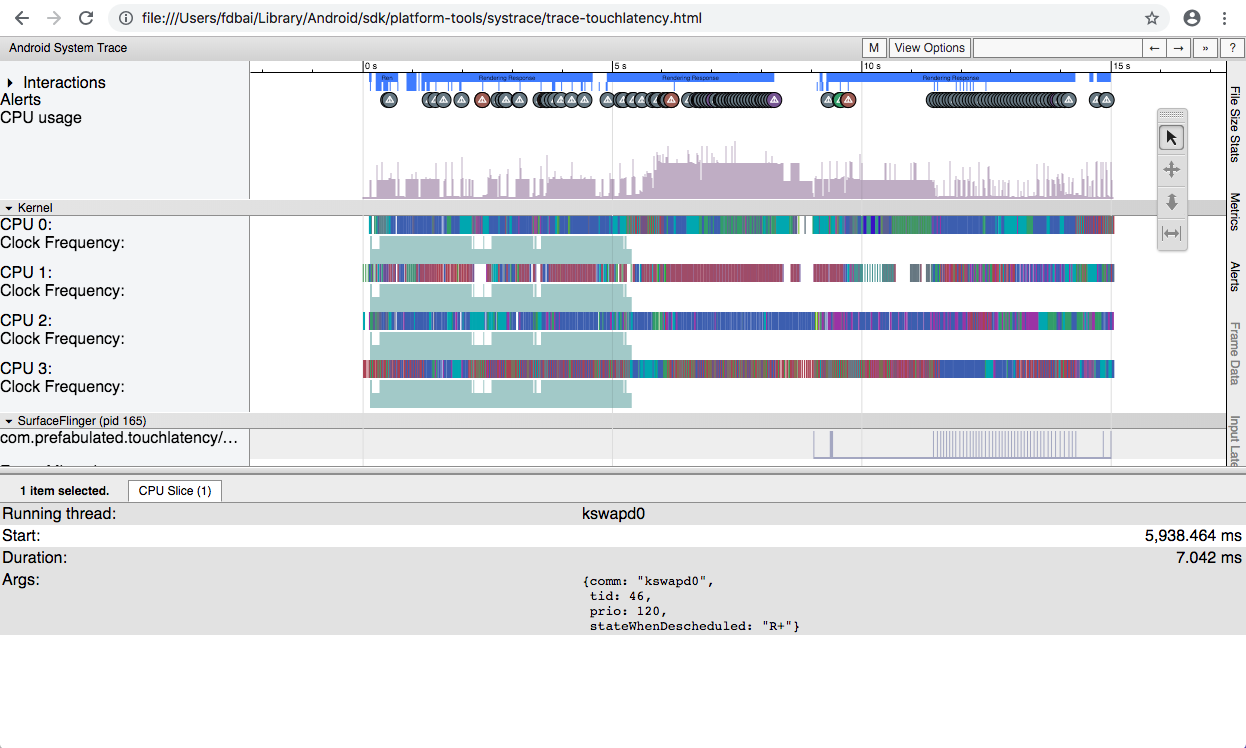
The following screenshot gives us an overview of how systrace report looks
like:
Using systrace
A quick help will tell us what systrace supports:
fdbais-MacBookAir:systrace fdbai$ pwd
/Users/fdbai/Library/Android/sdk/platform-tools/systrace
fdbais-MacBookAir:systrace fdbai$ python systrace.py --help
Usage: systrace.py [options] [category1 [category2 ...]]

Example: systrace.py -b 32768 -t 15 gfx input view sched freq

Options:
  -h, --help            show this help message and exit
  -o FILE               write trace output to FILE
  -j, --json            write a JSON file
  --link-assets         (deprecated)
  --asset-dir=ASSET_DIR
                        (deprecated)
  -e DEVICE_SERIAL_NUMBER, --serial=DEVICE_SERIAL_NUMBER
                        adb device serial number
  --timeout=TIMEOUT     timeout for start and stop tracing (seconds)
  --collection-timeout=COLLECTION_TIMEOUT
                        timeout for data collection (seconds)
  -t N, --time=N        trace for N seconds
  --target=TARGET       choose tracing target (android or  linux)
  -b N, --buf-size=N    use a trace buffer size  of N KB
  -l, --list-categories
                        list the available categories and exit

  Atrace options:
    --atrace-categories=ATRACE_CATEGORIES
                        Select atrace categories with a comma-delimited list,
                        e.g. --atrace-categories=cat1,cat2,cat3
    -k KFUNCS, --ktrace=KFUNCS
                        specify a comma-separated list of kernel functions to
                        trace
    --no-compress       Tell the device not to send the trace data in
                        compressed form.
    -a APP_NAME, --app=APP_NAME
                        enable application-level tracing for comma-separated
                        list of app cmdlines
    --from-file=FROM_FILE
                        read the trace from a file (compressed) rather than
                        running a live trace

  Atrace process dump options:
    --process-dump      Capture periodic per-process memory dumps.
    --process-dump-interval=PROCESS_DUMP_INTERVAL_MS
                        Interval between memory dumps in milliseconds.
    --process-dump-full=PROCESS_DUMP_FULL_CONFIG
                        Capture full memory dumps for some processes. Value:
                        all, apps or comma-separated process names.
    --process-dump-mmaps
                        Capture VM regions and memory-mapped files. It
                        increases dump size dramatically, hence only has
                        effect if --process-dump-full is a whitelist.

  BattOr trace options:
    --battor-categories=BATTOR_CATEGORIES
                        Select battor categories with a comma-delimited list,
                        e.g. --battor-categories=cat1,cat2,cat3
    --serial-map=SERIAL_MAP
                        File containing pregenerated map of phone serial
                        numbers to BattOr serial numbers.
    --battor-path=BATTOR_PATH
                        specify a BattOr path to use
    --battor            Use the BattOr tracing agent.

  Ftrace options:
    --ftrace-categories=FTRACE_CATEGORIES
                        Select ftrace categories with a comma-delimited list,
                        e.g. --ftrace-categories=cat1,cat2,cat3

  WALT trace options:
    --walt              Use the WALT tracing agent. WALT is a device for
                        measuring latency of physical sensors on phones and
                        computers. See https://github.com/google/walt
The available categories on device may vary depending on the device you’re using.
-l option can be used to list the supported categories.
-a option can be used for tracing app, Trace class was introduced
after Android 4.3, by using this class you can see what parts of the app has
issue, fore more information about using Trace class refer to Instrument your
app code section of systrace overview.
what is atrace
atrace is android native binary tools used for capture kernel events using ftrace, the source code is under frameworks/native/cmds/atrace directory, atrace has the similar options with systrace:
rpi3:/ # atrace --help
usage: atrace [options] [categories...]
options include:
  -a appname      enable app-level tracing for a comma separated list of cmdlines
  -b N            use a trace buffer size of N KB
  -c              trace into a circular buffer
  -f filename     use the categories written in a file as space-separated
                    values in a line
  -k fname,...    trace the listed kernel functions
  -n              ignore signals
  -s N            sleep for N seconds before tracing [default 0]
  -t N            trace for N seconds [default 5]
  -z              compress the trace dump
  --async_start   start circular trace and return immediately
  --async_dump    dump the current contents of circular trace buffer
  --async_stop    stop tracing and dump the current contents of circular
                    trace buffer
  --stream        stream trace to stdout as it enters the trace buffer
                    Note: this can take significant CPU time, and is best
                    used for measuring things that are not affected by
                    CPU performance, like pagecache usage.
  --list_categories
                  list the available tracing categories
 -o filename      write the trace to the specified file instead
                    of stdout.
Use --list_categories option to see a list of available tracing categories:
rpi3:/ # atrace --list_categories
         gfx - Graphics
       input - Input
        view - View System
     webview - WebView
          wm - Window Manager
          am - Activity Manager
          sm - Sync Manager
       audio - Audio
       video - Video
      camera - Camera
         hal - Hardware Modules
         app - Application
         res - Resource Loading
      dalvik - Dalvik VM
          rs - RenderScript
      bionic - Bionic C Library
       power - Power Management
          pm - Package Manager
          ss - System Server
    database - Database
     network - Network
         adb - ADB
         pdx - PDX services
       sched - CPU Scheduling
         irq - IRQ Events
         i2c - I2C Events
        freq - CPU Frequency
        idle - CPU Idle
        disk - Disk I/O
         mmc - eMMC commands
       workq - Kernel Workqueues
  regulators - Voltage and Current Regulators
  binder_driver - Binder Kernel driver
  binder_lock - Binder global lock trace
   pagecache - Page cache
Capture trace log with systrace
systrace is a python wrapper for host side, it interacts with android side tool atrace to generate final report. Since I do not have adb connection I use atrace to dump trace to trace.dat, then generate html report with --from-file option of systrace.
Capture trace log without adb connection
rpi3:/ # atrace sched freq idle am wm gfx view binder_driver irq workq input
-t 10 -b 96000 -o /data/trace.dat
It will prompt done when the time you specified time expires.
capturing trace… done
How to generate systrace report with offline trace file
fdbais-MacBookAir:systrace fdbai$ python systrace.py --from-file=trace.dat
Reading results from file.
Tracing completed. Collecting output...
Outputting Systrace results...
Tracing complete, writing results

Wrote trace HTML file: file:///Users/fdbai/Library/Android/sdk/platform-tools/systrace/trace.html
How to view systrace report
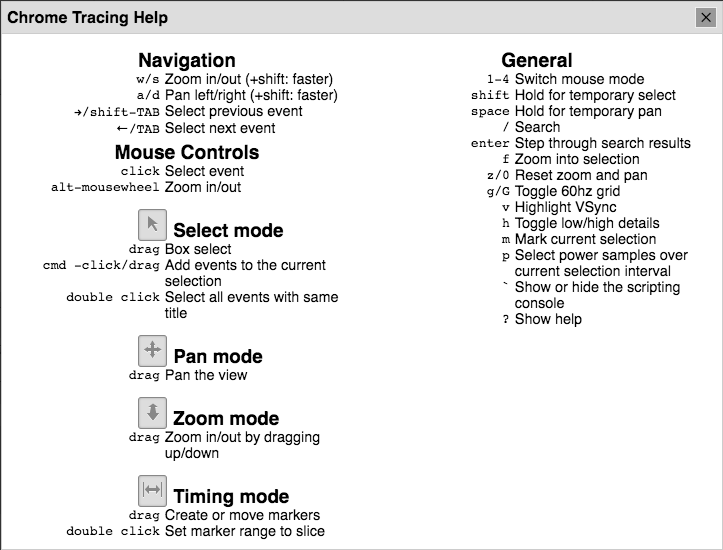
The systrace report support a list of shortcut keys, click the question mark
in the top right cornner of the report to show the help window:
Press v to highlight Vsync to get a good sense of what 16ms looks like.
NOTE only googe chrome is working for viewing the report, Safari and Firefox were confirmed not working for now. Install with the following command:
brew cask install google-chrome
I’m tested against Version 69.0.3497.81 (Official Build) (64-bit)
Inspecting frames and alerts
Frames that render within the 16.6 millisecond required to maintain a stable 60 frames per second are indicated with green frame circles. Frames that take longer than 16.6 milliseconds to render are indicated with yellow or red frame circles.